Ripple was quite volatile for the first half of December of last year, but the second half was characterized by a very tight sideways chop between support at 0.000013, and resistance at 0.000015. This range bound trading continued for most of January. Price has used the bottom of the trading range as support about eight times. The top of the trading range at 0.000015 was violated today on heavy volume, so this level might act as support in the near future. If the market retraces over the next few days, the 0.000015 area may be a good place to look for buying opportunities.

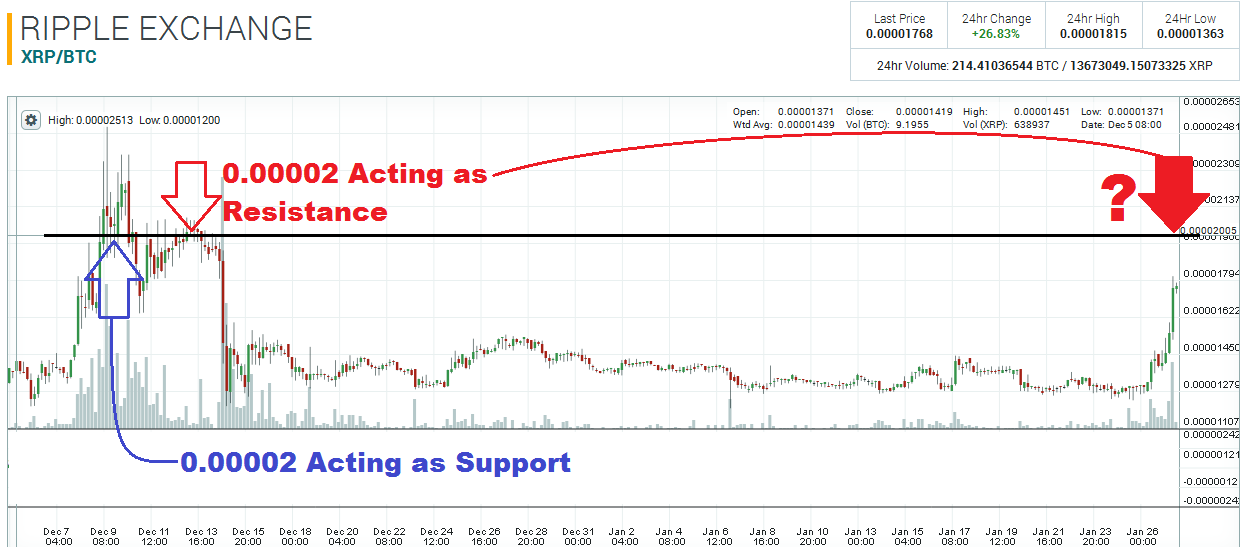
The market rallied quite hard today, so the big question is: how much higher can it go? The 4-hour chart shows that 0.00002 played a key role during the first half of December; support on the 9th; resistance on the 12th and 13th. The market is now approaching this level from underneath, therefore, this pivot zone is likely to act as a barrier once again. Mark this level on your charts!

Disclaimer: This is not trading/investment advice!
Chart source: https://poloniex.com/exchange#btc_xrp
If you liked this article follow us on twitter @themerklenews and make sure to subscribe to our newsletter to receive the latest bitcoin and altcoin price analysis and the latest cryptocurrency news.
No Responses