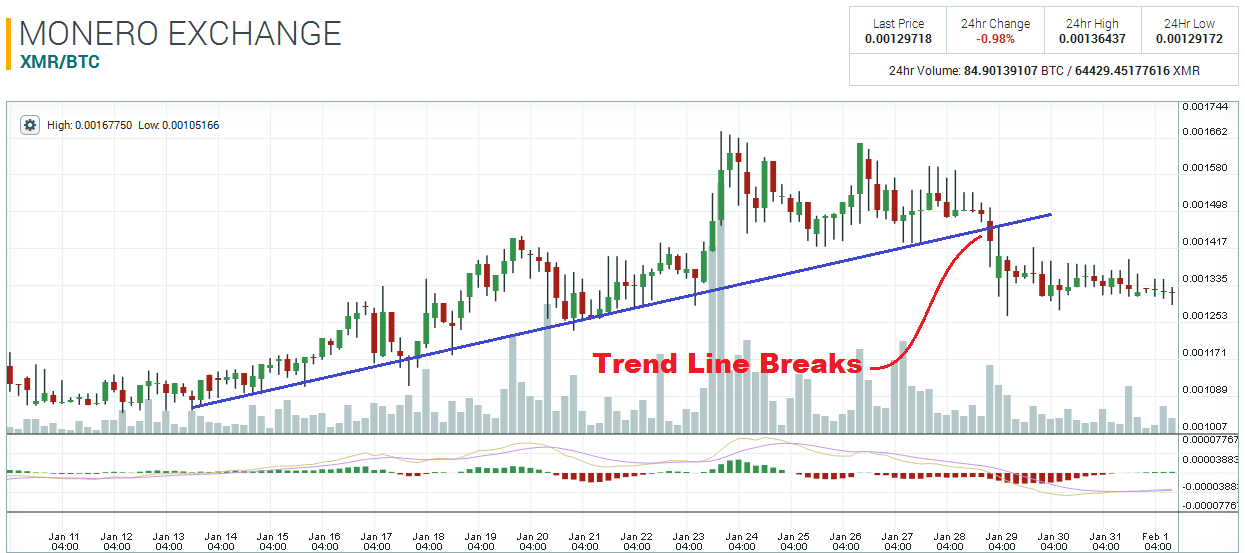
Monero started trending higher in the middle of January, but it looks like the trend has begun to lose momentum. In fact, the technical indicators show that the market may even reverse. For starters, the the trend line – which price bounced from multiple times in January – has been finally broken to the downside on January 28.

Also, on that same day, the pivot zone at 0.0014 was broken as well. This price level has acted as resistance on three occasions during January, and another two times as support. Since price is now trading around 0.001935, the 0.0014 is very likely to now act as resistance again.

Although price has broken some major technical areas in the last few days, there is also a major pivot zone that is still holding price for the time being. The 0.0013 level goes all the way back to the end of December when it acted as resistance, and also another two times during the middle of January. The market is now essentially stuck between 0.0013 and 0.0014, therefore, a break of either these two monster pivot levels will determine market direction in the near future.

Disclaimer: This is not trading/investment advice!
Chart Source: https://poloniex.com/exchange#btc_xmr
If you liked this article follow us on twitter @themerklenews and make sure to subscribe to our newsletter to receive the latest bitcoin and altcoin price analysis and the latest cryptocurrency news.
No Responses