Monero Price Analysis (XMR/USD)
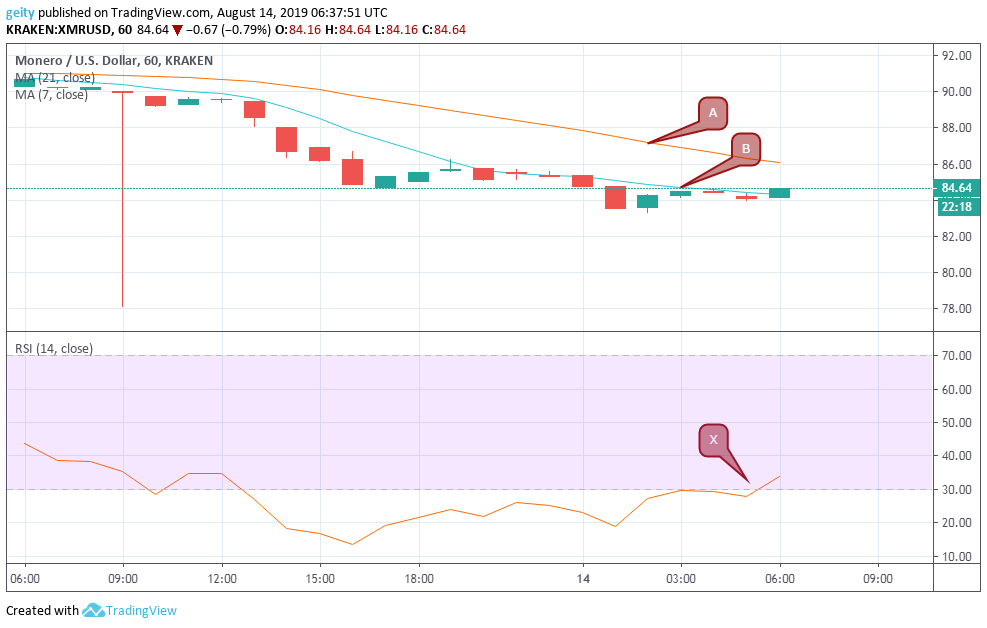
On an intraday chart, XMR/USD has experienced significant loss over the last 24hrs. The bearish pressure was bolstered by the 21 day moving average that strongly traded above the 7 day moving average throughout the intraday.
XMR has down surged by 6.6%, having begun trading yesterday at $90.65. It is now changing hands at $84.64 signaling a bearish sign. The Relative Strength Index indicator has shown a decrease in investor’s sentiments since it was seen hovering below level 30 most of the times, which is marked as an oversold market territory.
However, the RSI indicator later slightly gained momentum and is at the moment heading Northway, which indicates an increase in buyouts. Investors are now holding on the XMR holdings in order to go short when the price is better.
Monero Price Prediction (XMR/USD)
An increase in the bearish run is likely to be seen since the 21 day MA is still above the 7 day MA. New targets should be set at $80.00.
Cardano Price Analysis (ADA/USD)
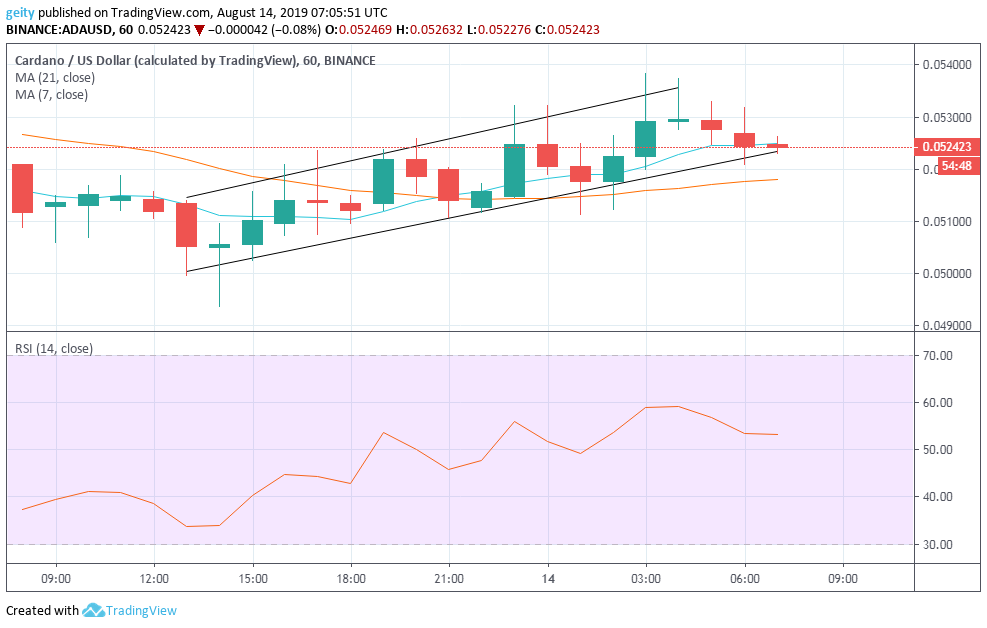
Unlike monero, ADA/USD pair has impressively performed since the bulls seemed to run the market momentum. The trend is bullish that has been reflected by the ascending channels. The market opened the session trading at $0.051162 and is currently trading at $0.052423, this sum up to 2.4% increase over the last 24hrs.
Additionally, the upward rally was supported by the 7day MA that is lately above the 21 day MA. The RSI indicator also signaled an increase in buying pressure since it was seen ascending from the low of 33 to a high of 55. Notably, Increase in the pair’s price has thereby positively affected investors sentiments that brought its market capitalization to the tune of $1.36 billion and a circulating supply of 25,927,070,538 coins over the intraday.
Cardano Price Prediction (ADA/USD)
Currently, the 7 day MA is still above the 21 day MA that signals a bullish sign. A further upward rally is thereby to b expected with new targets stood at $0.054000. However, if the price breaks the 21 day MA then traders can enter and take profit at $0.050000.
Stellar Price Analysis (XLM/USD)
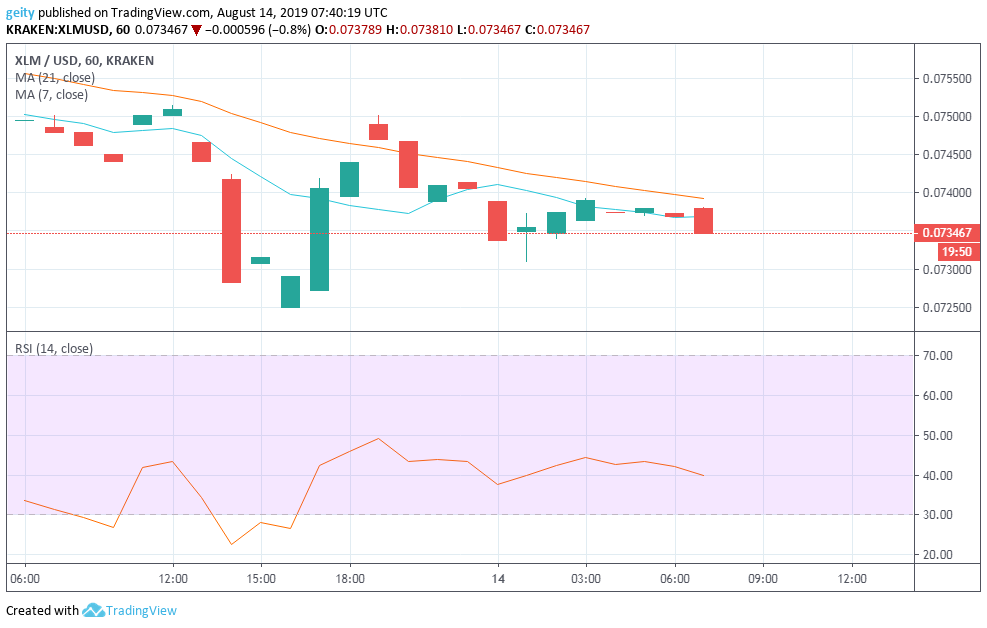
Like Monero, Stellar lumen has also exhibited a downward pressure. With support from the 21 day MA that hovered strongly above the 7 day MA throughout the intraday. XLM/USD pair started the sell-offs trading at very small number of transaction as reflected by the presence of a four-price Doji that was at $0.074948.
This was followed by a pull down by an engulfing pattern that dipped the price action down to rally at a low of $0.072828. This was reflected by the RSI area where it was seen below level 30 that is known as the oversold market territory. A pull up was later seen since the bulls managed to pick up the momentum and pushed the price upwards to rally at a high of $0.075013.
The market later on embarked to a steady flow to currently changing hands at $0.073467 that translates to a down surge of 2.0% over the last 24hrs. The RSI indicator is currently hovering between level 40 and 60 that signal a lack of dominance from either the buyers or the sellers.
Stellar Price Prediction (XLM/USD)
More bear market should be expected as indicated by the 21 day MA that is now above the 7 day MA. New targets should be set at $0.072500. If the price action breaks the 21day MA then traders should consider going long and take profit at $0.074500.
Cryptocurrency Charts By Tradingview
Disclaimer: This is not trading or investment advice. The above article is for entertainment and education purposes only. Please do your own research before purchasing or investing into any cryptocurrency or digital currency.