Since yesterday’s brutal sell-off that saw ETH plunge down to a low 0.01961, Ethereum’s trading range has been progressively getting narrower. The 15-minute chart shows a clear triangle formation, which indicates that the market may be getting ready to move again.

Before ETH can rally, the pivot zone at 0.022 – which Ethereum is currently trading under – has to be broken. This level has acted as support about three times since yesterday, and when the exchange rate broken under 0.022 today, this level started to act as resistance. So, price would have to surmount this barrier first, before making another attempt towards the all-time high at 0.02388999.

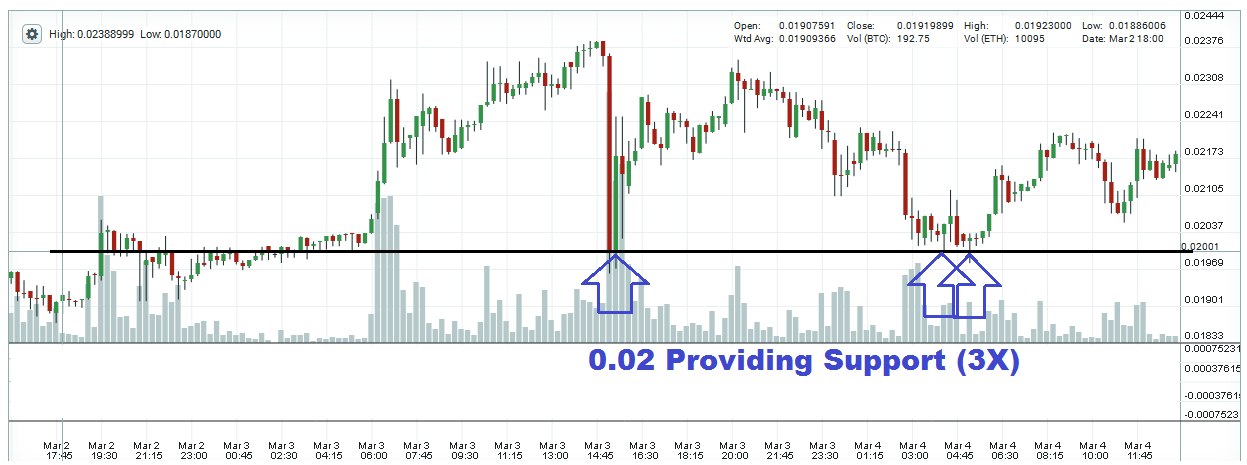
If the triangle formation resolves itself to the downside, 0.02 would most likely come into play. When the market sold-off yesterday, it hit a low of 0.01961, but could not stay under 0.02, therefore, this area is now considered support. The market revisited 0.02 again today, but bounced higher very quickly. The 0.02 level is now a double support zone, so any sell-off in the future will likely encounter trouble at 0.02!

Disclaimer: This is not trading/investment advice!
Chart Source: https://poloniex.com/exchange#btc_eth
If you liked this article follow us on twitter @themerklenews and make sure to subscribe to our newsletter to receive the latest bitcoin and altcoin price analysis and the latest cryptocurrency news.
No Responses