
Both cryptocurrencies are trading on a sideways trend. This shows that there is a lack of market momentum and confidence in the crypto. Both are undergoing a bearish outlook with all indicators supporting the downward price rally.
In most instances, previous supports have been dropped as the downtrend continues. Besides, all the significant levels have been tested severally. On the hourly charts, the 21 day MA is above the 7 day MA during the last hour. This, therefore, predicts a downward price movement in the coming few hours.
BTC/USD
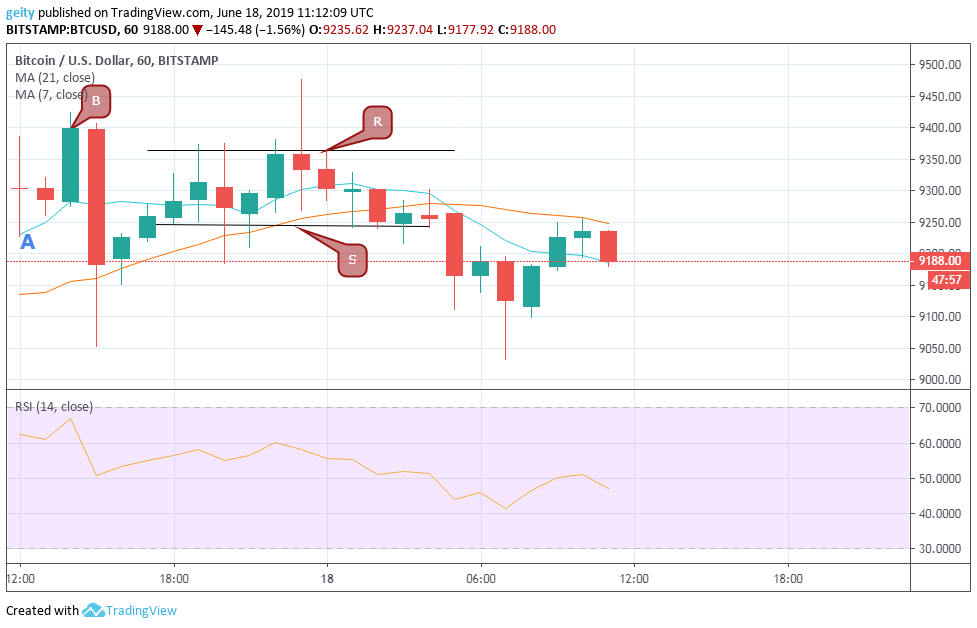
The leading cryptocurrency is trading on a sideways trend during the last 24hrs. The trend is therefore supported by the intertwining moving averages. BTC/USD pair started selling off at $9303.34 with a long-legged Doji that shows indecision in the market at that period.
This was followed by a bullish regular divergence pattern that pushes the price up to close at $9399.28 but the price was later on pulled down due to strong selling pressure that was encountered, as reflected by the decreasing RSI indicator, indicating that the market momentum is predominantly with sellers.
The price momentum, later on, consolidates around the support level $9243.34 and resistance level $9364.10 for a short period before breaching the support level where it dropped to a low of 9029.80 at around 18 June 07:00. BTC is therefore currently trading at $9188.00 thus it has dipped by 1.2%
Bitcoin Price Prediction
Downward price movement is likely to continue since the 21 day MA is still on top of the 7 day MA. The new target should be set at $9176.61.
XRP/USD
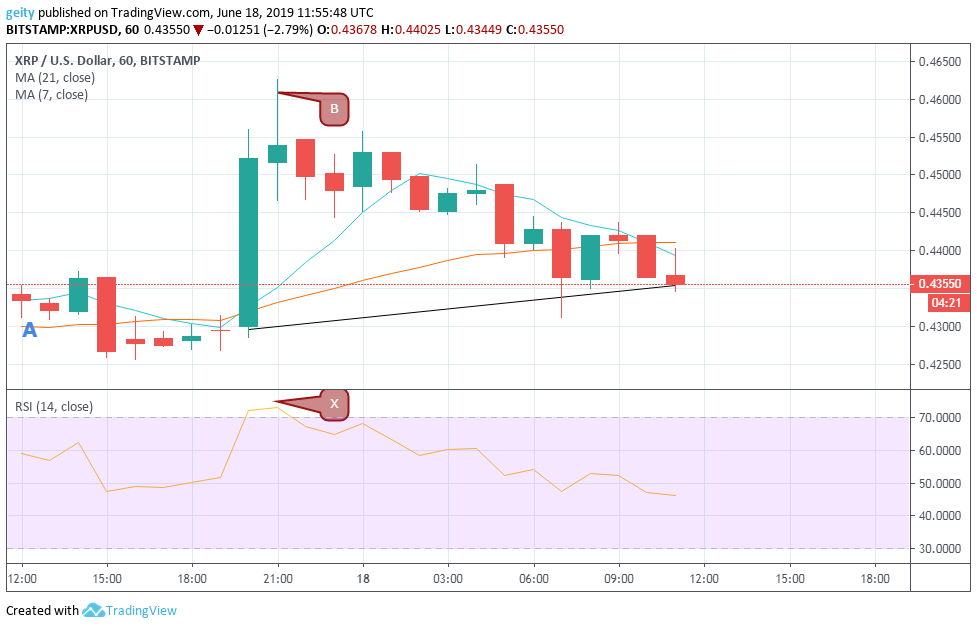
XRP/USD pair is experiencing a bearish outlook, the coin, therefore, began trading at $0.44791 (A) against the current price of $0.43550 thus shows is down by 2.8%. The downtrend is supported by the descending triangle.
At around 17 June 20:00, the RSI indicator is seen above the level 70, indicating an overbought market that reflected a breakout that pushed the price performance up to a high of $0.46268 (B).this was followed by a downtrend that dips the price to its current value of $0.43550.
The decrease in the RSI indicator shows an increase in buyouts by traders thus sellers have the upper hand.
XRP Price Prediction
The 21 days MA is seen above the 7 day MA indicating a bearish signal in the next few hours. The new target should, therefore, be set at $0.43100.
TRX/USD
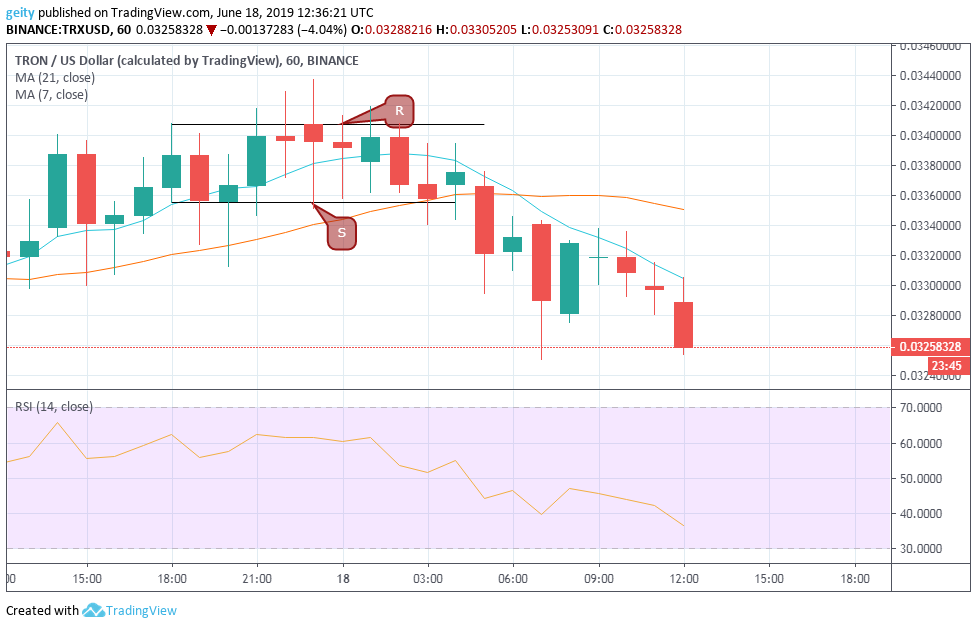
TRX/USD pair has put up a bearish outlook in the last 24 hours, with all indicators supporting a downward price momentum. It started selling off around 17 June 13:00 at $0.033297 with a strong buying pressure but as time goes by the pressure seem to decrease.
The price later consolidated around the significant level; the resistance level being $0.034071 and the support level being $0.033552. This resulted in a breakdown whereby sellers took control over the market momentum thus increasing selling pressure as reflected by the declining RSI.
This, therefore, placed TRX to $0.032583 at the press time that has dipped by 2.1%. This may be because of a lack of confidence in the coin by traders that results in increase buyouts.
Tron Price Prediction
A downtrend is likely to be seen because the 21 day MA is still on top of the 7 day MA. The RSI is heading south indicating a decrease in price.
Disclaimer: This is not trading or investment advice. The above article is for entertainment and education purposes only. Please do your own research before purchasing or investing into any cryptocurrency or digital currency.
Cryptocurrency Charts By Tradingview
Originally Appeared on NullTX