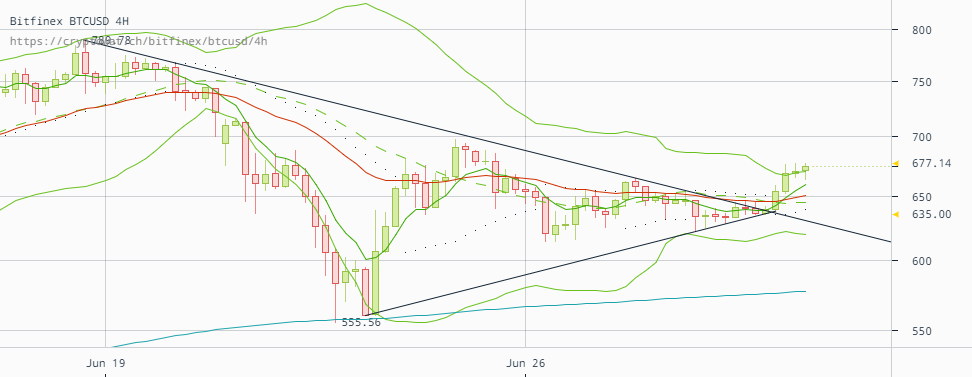
Bitcoin price managed to break out of a triangle formation. The BTCUSD pair was trapped inside a flat that was formed since the price bottomed at the $555 mark. Although the price quickly recovered it was incapable of breaking the $700 resistance zone. Now bulls are trying to slowly overcome this hurdle.
On June 18, Bitcoin established a two-year all-time-high, after reaching the $789.78 mark (data via Bitfinex) the price found sellers, driving it down to a minimum of $555. After that, the price has been consolidating, forming a flat ranging from $614 to $664.

The triangle formation
The downtrend trend line prevented gains but at the same time ‘higher lows‘ were forming, this indicates that the price is consistently making gains. Both tendencies converged at a crucial point. Bears were unable to push down the price, and the trend line they formed broke apart.

‘Higher Lows’ in the chart.

The daily candle will confirm or deny the current uptrend.
The MACD in the daily chart suggests that the new bull rally hasn’t even started. The next daily candle should be green to confirm the uptrend, alternatively, it could be a stretched red candle (consolidation). The next resistance areas are $700-$716. If the volume is able to pick up the pace, we could see the price testing the $800 area soon. Traders on the sidelines (and wanting to go long) should wait until the price retraces to the 30MA on the 1HR range to add
- Support Level: $660.
- Resistance: $677.
If you liked this article follow us on Twitter @themerklenews and make sure to subscribe to our newsletter to receive the latest bitcoin and altcoin price analysis and the latest cryptocurrency news.