Ethereum has stayed under 0.003 since the start of November. In fact, the market has failed to break above 0.003 on five different occasions this month. If we observe the price action on the 2-hour chart, an ascending triangle formation can be clearly identified. These patterns usually resolved themselves with a very violent break in either direction. The big question: which way is this gonna break?

Let’s take a look at the 30-minute chart for further clues. The 0.00295 area has played a very prominent role in the past few days; three times as resistance; four times as support. Price recently closed underneath 0.00295, so this level may turn into resistance now.

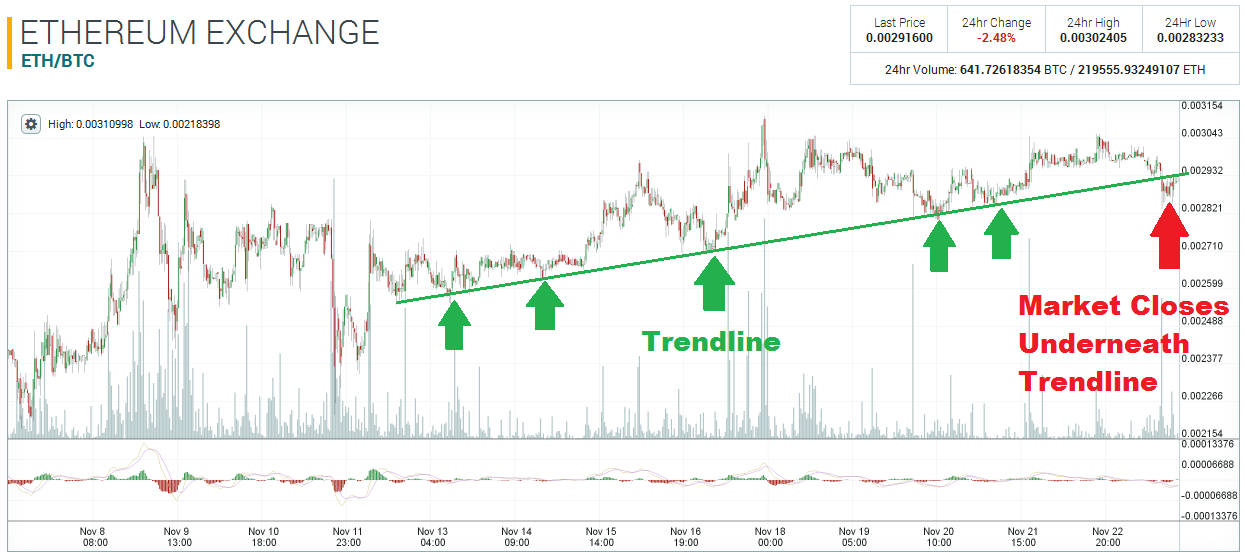
There is a also a very clear trend-line, which started on the 13th of November. The market has bounced from this trend-line many times since the 13th. However, this trend-line was broken today! So, it seems the lower time frames are hinting at a bearish market sentiment. Unless price manages to get back above 0.00295, the most likely direction seems to be down.

Disclaimer: This is not trading/investment advice!
Chart Source: https://poloniex.com/exchange#btc_eth
If you liked this article follow us on twitter @themerklenews and make sure to subscribe to our newsletter to receive the latest bitcoin and altcoin price analysis and the latest cryptocurrency news.
No Responses