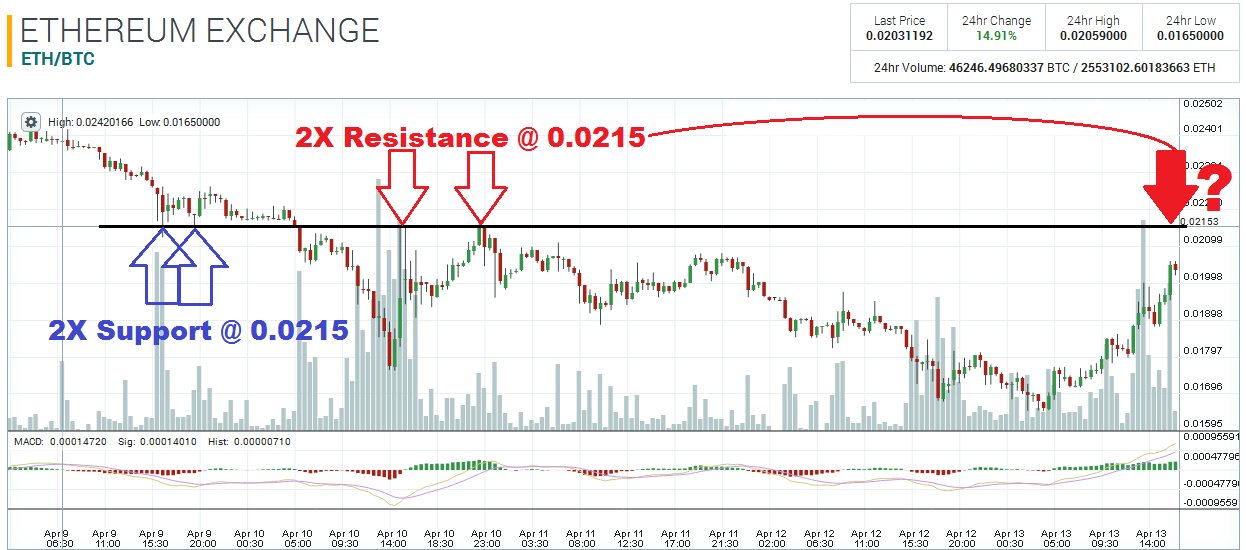
The 0.0215 area has played a prominent role since the beginning of March, when the market first used this level as support. The second time was on the 18th of March, when price abruptly reversed as soon as it hit the 0.0215 level. However, this area turned into resistance on the 10th, when price closed underneath 0.0215 and could not make it above this level any more.

If fact, the 15-minute chart shows this process quite clearly. Price attempted to get above 0.0215 on two occasions that day, but failed, and the market continued to sell-off. This area is now a major pivot zone with an extensive history, and should be marked on every trader’s chart. The market is now approaching this area from below, therefore, the 0.0215 zone is likely to now act as resistance. If the market can break above 0.0215 at some point, a rally towards the other major pivot at 0.024 would not be out of the question.

The 0.017 area is also a major long-term pivot zone now. The 4-hour chart shows that 0.017 first acted as resistance on the 12th of February. When price touched this level today for the first time in two months, the trend reversed very quickly, which shows how closely this level is being watched by market participants. If ETH breaks under 0.017 at some point in the future, the bear market will accelerate!!

Disclaimer: This is not trading/investment advice!
Chart Source: https://poloniex.com/exchange#btc_eth
If you liked this article follow us on twitter @themerklenews and make sure to subscribe to our newsletter to receive the latest bitcoin and altcoin price analysis and the latest cryptocurrency news.