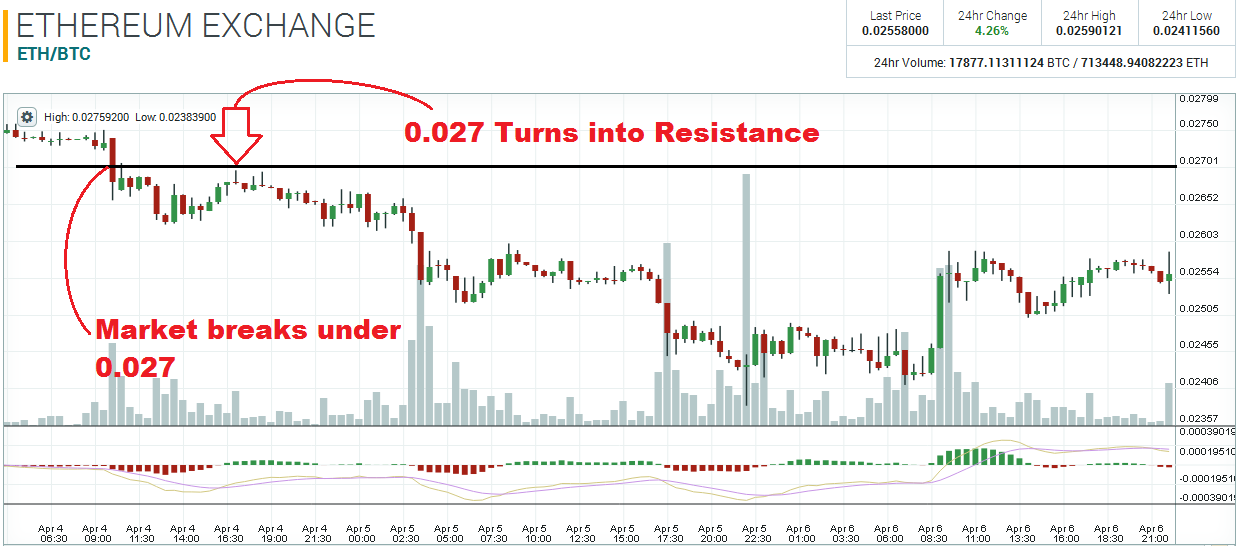
In my previous ETH analysis article – the one from three days ago – I wrote that price may head all the way down to the pivot at 0.024, if the 0.027 pivot zone failed to support the market. And that is what transpired on the 4th, when price slipped under 0.027 and that pivot zone turned into resistance.

Since the middle of March, the 0.024 area has acted as support five times! If price does break under this area at some point in the near future – just like 0.027 was broken – then price is very likely to descend all the way down to 0.02, and I would not be surprised to see ETH enter a full-scale bear market at that point. This area is extremely important.

There is another minor pivot zone that has developed since yesterday. The 30-minute chart shows that 0.025 area acted as resistance two times yesterday, which then turned into support, once price broke above this area today.

The 30-minute chart also shows a clear Head & Shoulders pattern, which suggest that price may rally towards 0.027 over the next few days. If price breaks under 0.025 again, this pattern would be invalidated.

Disclaimer: This is not trading/investment advice!
Chart Source: https://poloniex.com/exchange#btc_eth
If you liked this article follow us on twitter @themerklenews and make sure to subscribe to our newsletter to receive the latest bitcoin and altcoin price analysis and the latest cryptocurrency news.