
Cardano Price Analysis (ADA/USD)
ADA/USD pair has taken a bullish rally in the last 24hrs. The pair’s price has surged up by 3.3%, having moved from $0.0645 to the current price rate of $0.0667 over the previous 24hrs. ADA was also seen trading on a sideways trend that was confirmed by the horizontal channel.
The Relative Strength Index indicator moved up from yesterday’s oversold market territory and is currently at a high of 53.26 that signaled increase-buying pressure. This also showed that buyers had dominated the market momentum in the last 24hrs.
The resistance level was stood at $0.0669, and support level at $0.0633. Notably, both levels were tested repeatedly. The RSI indicator is currently heading north that showed the reluctance of traders to go short in anticipation for the better price value.
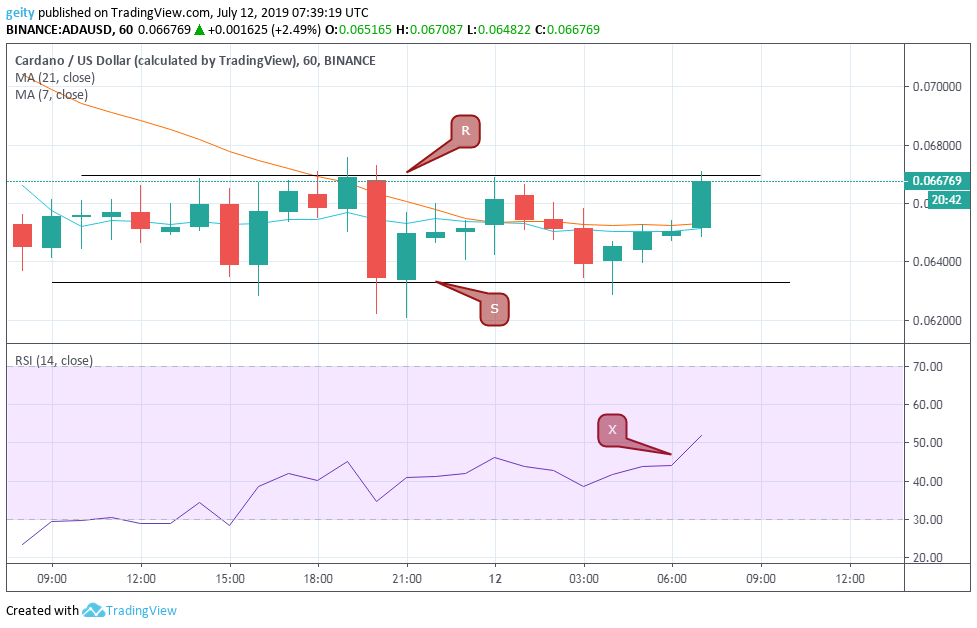
Cardano Price Prediction
At the moment, all indicators point at a bullish signal. With the 7 day MA looking set to cross over the 21 day MA and the RSI indicator is currently heading north that indicates further upward price rally. The resistance level $0.0669 is most likely to be breached. New target should be at $0.0700.
Tron Price Analysis (TRX/USD)
TRX/USD pair started trading at $0.02835 and is now trading at $0.02908. The upward price movement seemed to represent a minimal increase of 2.5% over the last 24hrs. The RSI indicator that was seen heading north reflected the bullish rally. New resistance level was placed at $0.02886 and, new support level was at $0.02729. The increase in the pair’s price led to increasing buyouts by investors, as shown by the RSI that moved from level 25 to 56 levels.
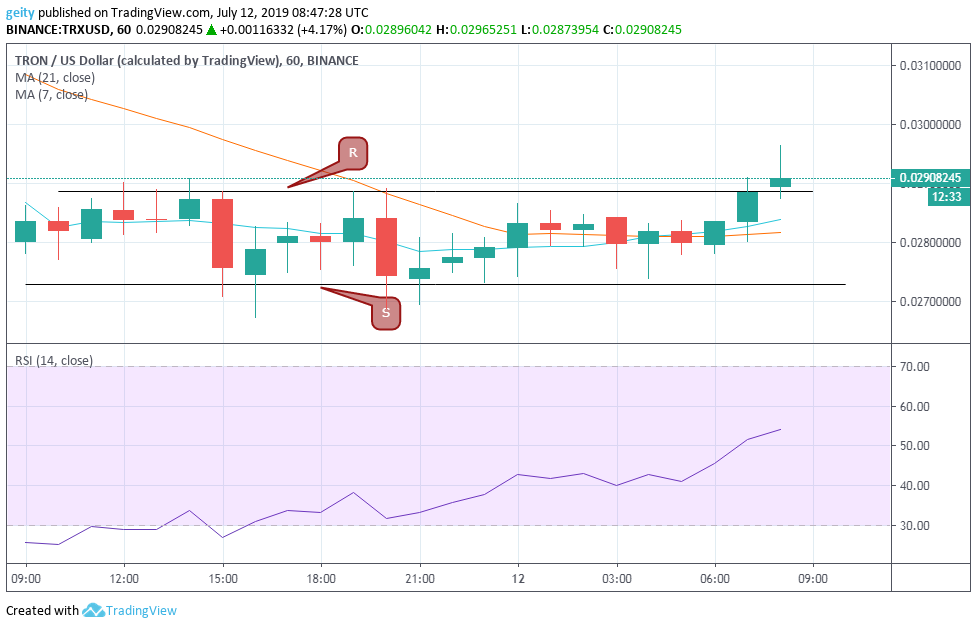
Tron Price Prediction
Like ADA, TRX is likely to encounter further bullish momentum, because the 7 day MA has crossed over the 21 day MA, and the RSI is heading north. With resistance level being broken, new targets should be set at $0.03000 and a stop-loss slightly below the support level at $0.02700.
EOS Price Analysis (EOS/USD)
The Bulls had dominated the market momentum over the last 24hrs. EOS/USD pair underwent a bullish outlook. That was bolstered by the 7 day MA that is currently above the 21 day MA that, indicated a bullish sign. The trend was sideways, which the horizontal channel confirmed. The RSI indicator climbed from a low of 26.43 to a high of 54.40 thus signaled an increase in buying pressure.
EOS is up by 3.4% having surged from $4.64731 to $4.81167 in the last 24hrs. Resistance level and support level was tested severally, but only resistance level was broken. Increase in the pair’s price signaled increase buyouts that led to a positive effect on investors. Currently, the RSI is trading flat, which indicates a lack of market momentum.
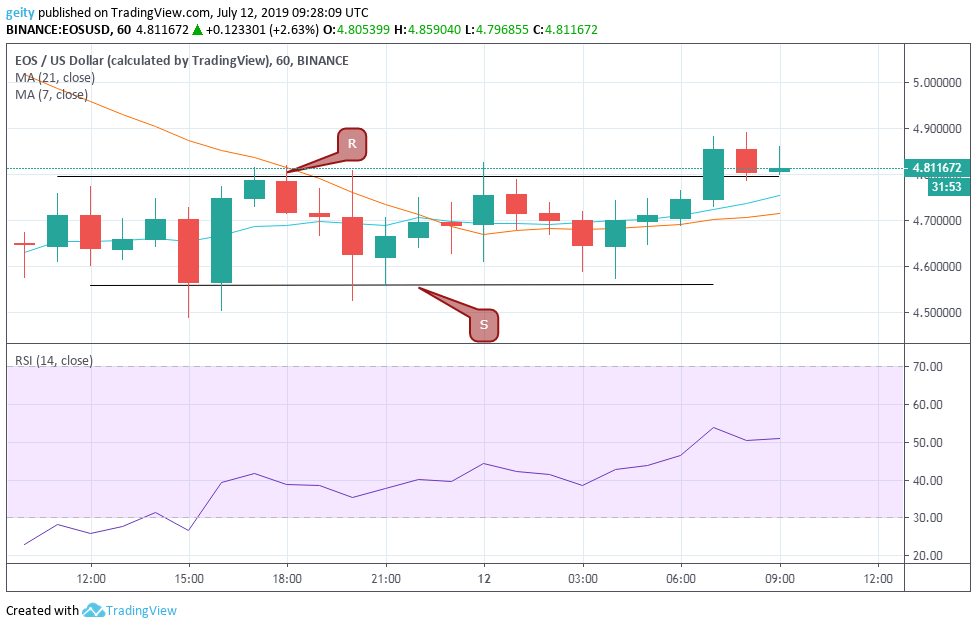
EOS Price Prediction
The 7 day MA is at the moment gravitating above the 21 day MA. This signals continuation of an upward price rally in the coming hours. New target should be set at $4.9000.
Cryptocurrency Charts By Tradingview
Disclaimer: This is not trading or investment advice. The above article is for entertainment and education purposes only. Please do your own research before purchasing or investing into any cryptocurrency or digital currency.