In My last BitShares technical article, the one on the 10th of March, I speculated that the break of the big pivot zone at 0.000013 was a major event, and that a bear market may follow. Since that time, the BitShares exchange rate has continued to drop, hitting a low of 0.00000824 just today.
While the selling has been very consistent over the past two weeks, price is now sitting on a major pivot zone. In 2016, the 0.0000085 area was used as resistance for the first time on January 16th, and this level began acting as support during February. The 2nd of March marked the last time BitShares used the 0.0000085 area as support – that was just prior to the big rally that pushed price all the way to 0.000229. Given the prior history of this area, I would say 0.0000085 may now act as support.

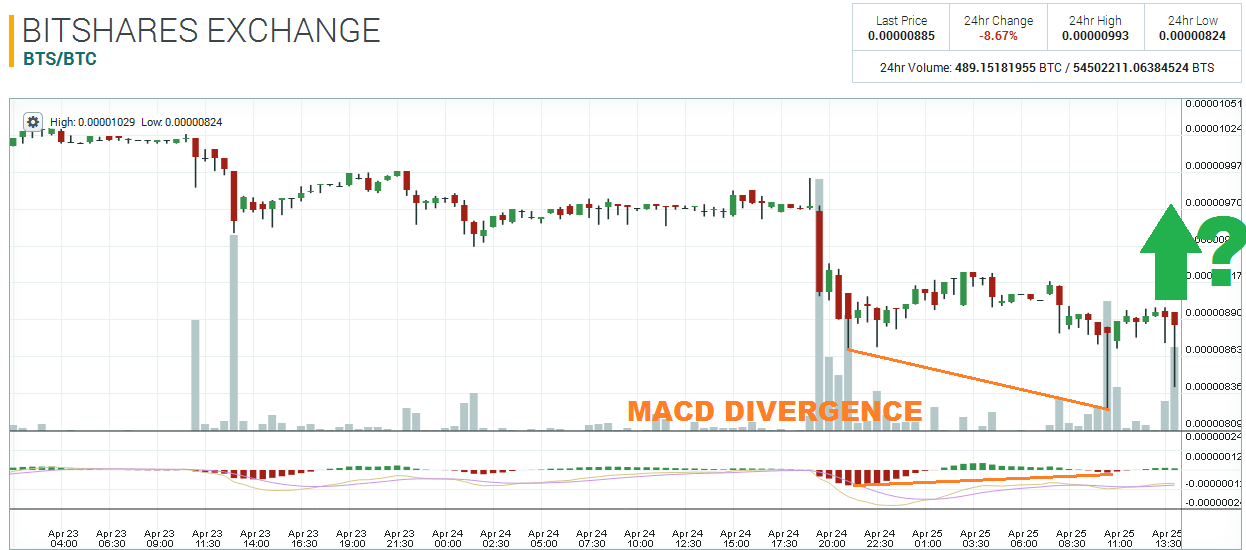
In fact, the 30-minute chart is showing that divergence has been forming since yesterday, which may be signaling that the market is a bit oversold.

However, even if price does find some support at 0.0000085 and rallies from it, there are several areas that are likely to act as barriers now. I am referring to 0.0000108 and 0.00001, which have been used quite extensively as support/resistance during April. Any rallies in the near future are very likely to encounter resistance at these zones. Mark these areas on your charts!


Disclaimer: This is not trading/investment advice!
Chart source: https://poloniex.com/exchange#btc_bts
If you liked this article follow us on twitter @themerklenews and make sure to subscribe to our newsletter to receive the latest bitcoin and altcoin price analysis and the latest cryptocurrency news.