BitShares hit a high of 0.00001101 on the 26th, and today the market hit another new high of 0.00001175. While on the lower time frame charts it’s not visible, the 4-hour chart shows a good amount of divergence on the MACD (Moving Average Convergence Divergence) indicator. There is also a fairly large Pin candlestick that indicates a lack of buyers above 0.000011. Price spiked very rapidly above 0.000011 and immediately dropped back down with even greater force. The divergence and the Pin candle together are signaling that the market may be getting ready to sell-off.

However, there is a fairly significant pivot zone at 0.0000095. This level acted as resistance/support several times over the past two days, and since price is currently trading above this area, this pivot may still support the market and prevent any large price drops.

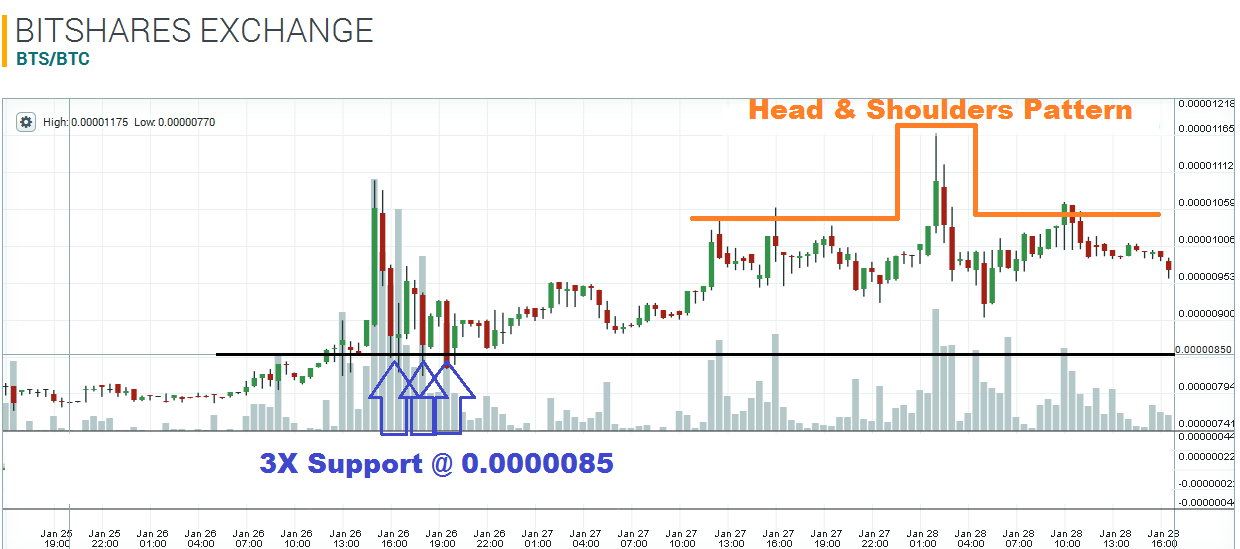
If price makes its way under 0.0000095, I would expect a sell-off towards the next pivot zone at 0.0000085. This level acted as support about three times on the 26th of January, so I would expect this area to be respected by the market. The 30-minute chart also shows a Head & Shoulders formation. Another bearish sign!

Disclaimer: This is not trading/investment advice!
Chart source: https://poloniex.com/exchange#btc_bts
If you liked this article follow us on twitter @themerklenews and make sure to subscribe to our newsletter to receive the latest bitcoin and altcoin price analysis and the latest cryptocurrency news.
No Responses