The bull market in Ethereum is continuing to show signs of weakness. The 4-hour chart sports a very large Pin candle, which has the highest volume (1213.2 BTC) of any candlestick going back to October of last year. These types of candlesticks – where price spikes up sharply and then abruptly crashes – usually appear at the end of bull markets, and are recognized as reversal signals by many experienced traders. So, if you are long ETH, keep that in mind!

An examination of the 30-minute chart reveals a very discernible Head & Shoulders pattern. The left and right shoulders are fairly well aligned, so it’s a very clean formation.

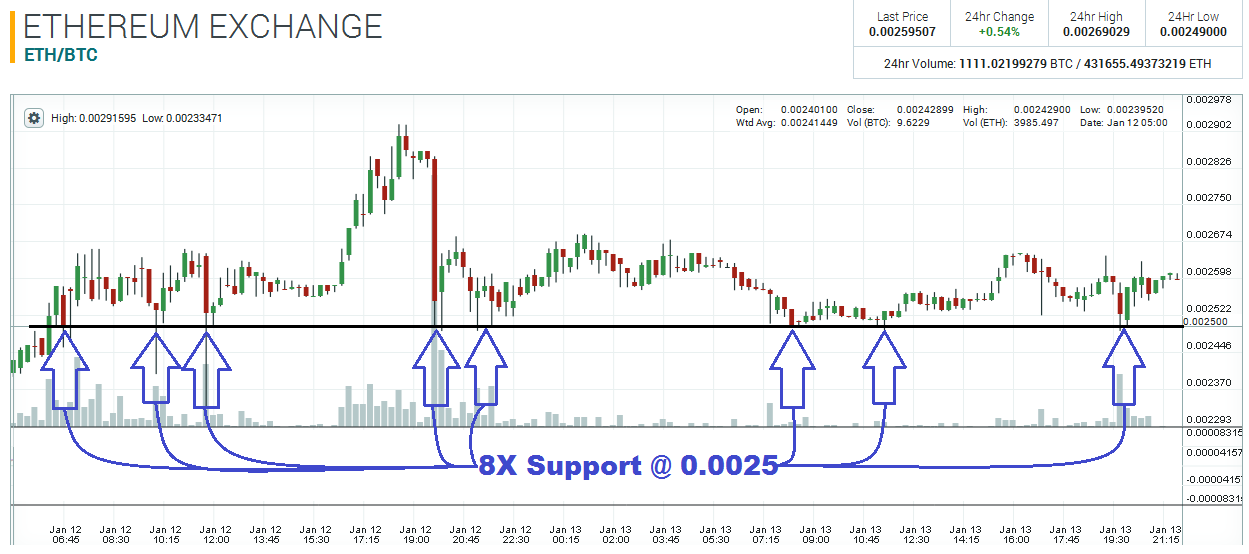
There is also a huge pivot zone at 0.0026. Price punched below this area yesterday, but was not able to close and stay under 0.0026 in the past two days. This level has now acted as support about eight different times, therefore, a break under this area will be a major event from a technical standpoint.

Disclaimer: This is not trading/investment advice!
Chart Source: https://poloniex.com/exchange#btc_eth
If you liked this article follow us on twitter @themerklenews and make sure to subscribe to our newsletter to receive the latest bitcoin and altcoin price analysis and the latest cryptocurrency news.
No Responses