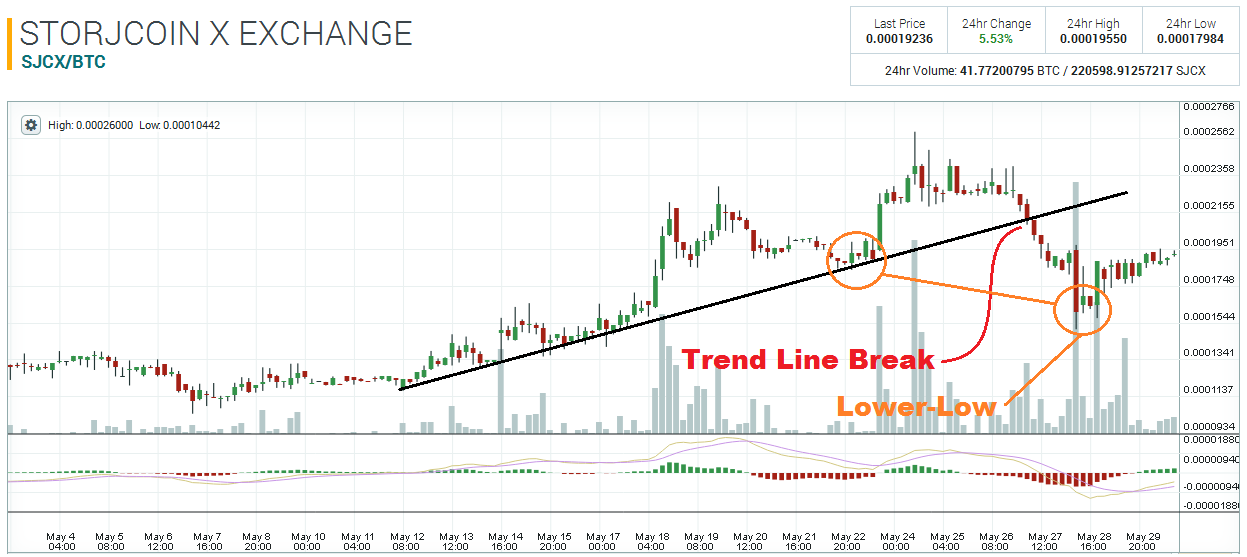
The June 2nd launch of the Storj open beta managed to push the token’s exchange rate to a high of 0.00026 – quite close to the massive resistance at 0.00028 – but it would seem there wasn’t sufficient momentum to maintain the trend. On May 27th, the trend line was broken and a new lower-low was printed on the following day. Technically speaking: the uptrend is over.

My previous article went over the importance of the 0.000164 pivot zone and that is precisely where the market found support on the 28th. The 2-hour chart show two distinct instances of the 0.00016 zone acting as support. This area should be marked on every trader’s chart.

While the 0.00022 level did not have any particular technical significance in prior months, this area has become quite significant over the past two weeks; twice as resistance between the 18th and 20th; acting as support on the 24th and 25th. If price trades up to this area over the next few days, it is quite likely that 0.00022 may act as resistance again, given its prior history.

Disclaimer: This is not trading/investment advice!
Chart source: https://poloniex.com/exchange#btc_sjcx
If you liked this article follow us on twitter @themerklenews and make sure to subscribe to our newsletter to receive the latest bitcoin and altcoin price analysis and the latest cryptocurrency news.