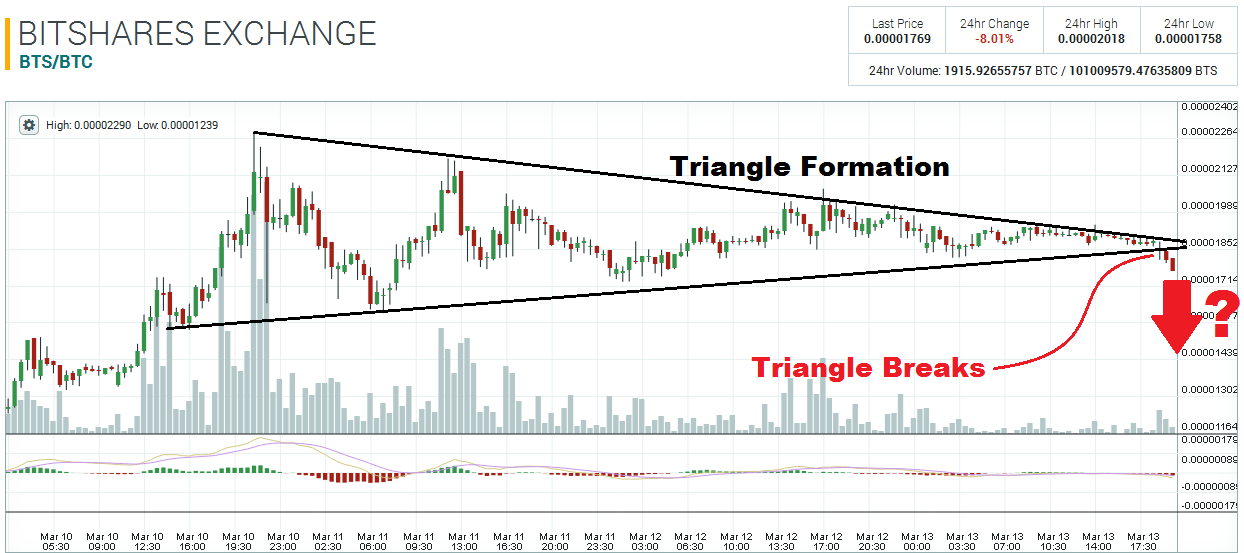
Since hitting a high of 0.0000229 on the 10th, BitShares has continued to trade in a progressively tightening trading range. The 30-minute chart shows a clear triangle formation, which has broken to the downside about an hour ago.

When BitShares was rallying on the 10th, the 0.000017 level acted once as resistance, and when the price finally broke above this level, 0.00007 then acted as support about three times. Seeing as the triangle formation has broken to the downside, price is likely to head south to at least 0.000017, where it will most probably encounter some support due to the prior history of this pivot level.

If 0.000017 doesn’t hold as support and price trades underneath it for a few hours, the probability of further selling increases substantially as 0.000017 may turn into resistance. If 0.000017 turns into resistance, the next significant pivot zone is found all the way down at 0.0000135.
Disclaimer: This is not trading/investment advice!
Chart source: https://poloniex.com/exchange#btc_bts
If you liked this article follow us on twitter @themerklenews and make sure to subscribe to our newsletter to receive the latest bitcoin and altcoin price analysis and the latest cryptocurrency news.
No Responses