The triangle formation – which I outlined in my previous Monero technical analysis – broke upwards in a very dramatic fashion. The market topped out at 0.00246 yesterday, and price sold-off in an even more dramatic fashion today. While not visible on the 2-hour and 4-hour charts, the 15-minute chart reveals that 0.0021 is now an important technical level. This area acted as resistance on two occasions on the 15th. The 0.0021 level turned into support when price broken above it on the same day. If price rallies again, the 0.0021 level will most likely act as resistance now.

The big question now is: will Monero continue to plunge?
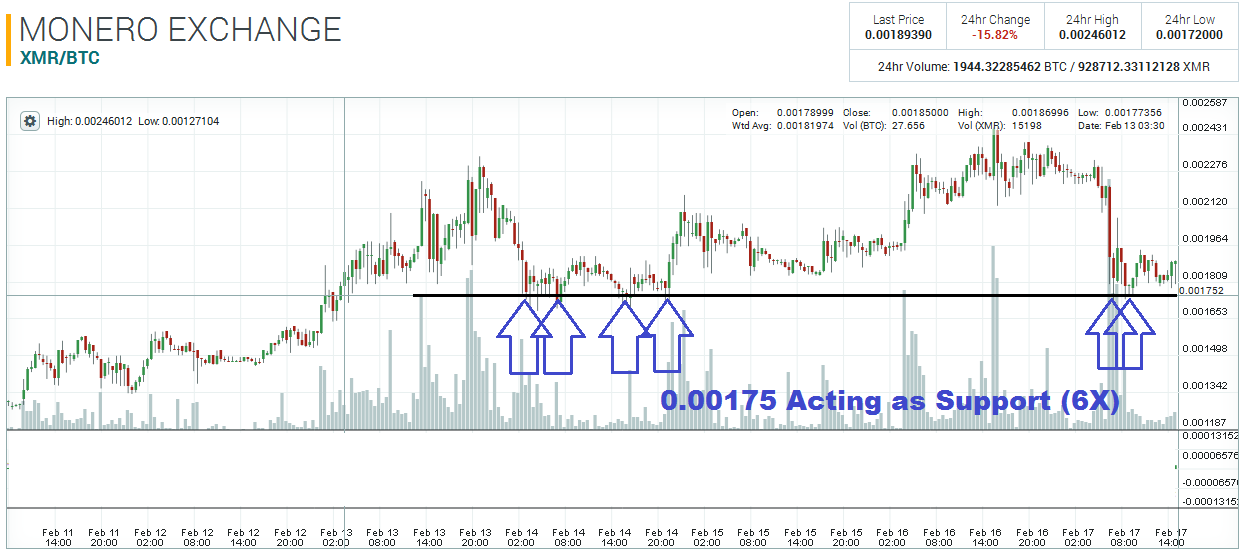
The answer to that question lies at the significant 0.00175 support level. This area has buttressed the market on six different occasions since the 13th of February. Unless the market breaks under this area and stays there for at least a few hours, this level will most likely continue to act as support.

Disclaimer: This is not trading/investment advice!
Chart Source: https://poloniex.com/exchange#btc_xmr
If you liked this article follow us on twitter @themerklenews and make sure to subscribe to our newsletter to receive the latest bitcoin and altcoin price analysis and the latest cryptocurrency news.
No Responses