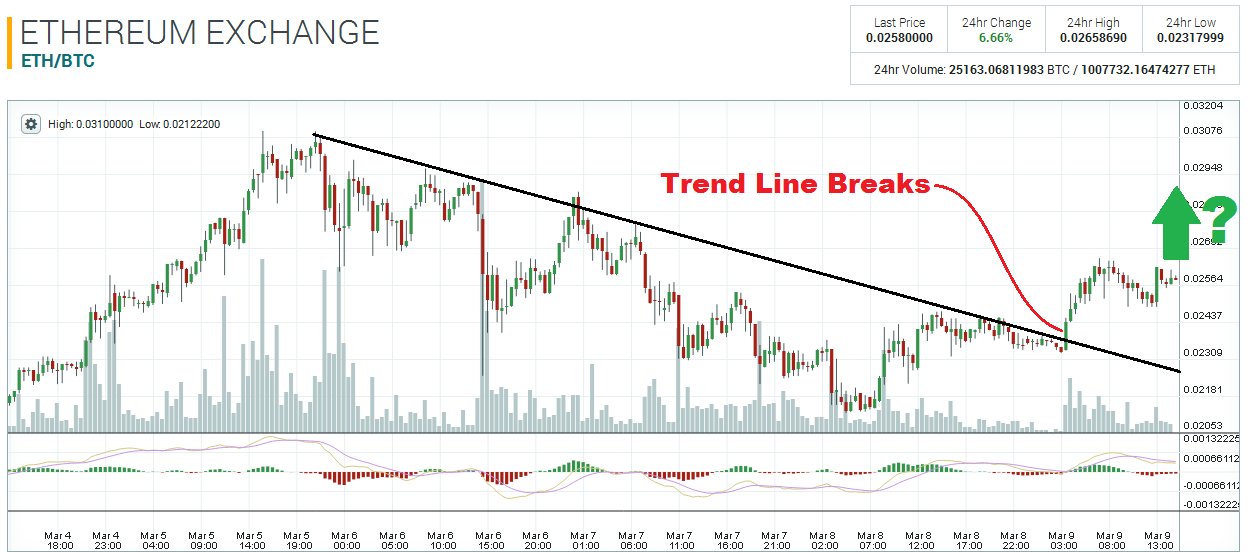
Ethereum has been in a downtrend since the 5th of March, but the 30-minute chart is showing that the trend line was broken today. From a technical perspective – the downtrend is over!

ETH’s exchange rate has managed to trade above some very significant pivot zones in the past two days. In my previous Ethereum analysis article, I outlined the importance of the 0.0265 price level and why every trader needs to be aware of it. The 0.0265 area acted as resistance again today, which brings the total amount of times this level has prevented the market from rallying to five! If price manages to get above 0.0265 and trade there for a few hours, a rally towards the big pivot zone at 0.029 becomes very likely.

In the past three days, the entire price range between 0.0245 & 0.025 has become one giant pivot zone. Once price slipped under 0.0245 on the 7th, this range turned into resistance and has acted as resistance about six times to date. The market had enough momentum to break above this range today, and the 0.025 area is now acting as support. However, if price slips under 0.0245 again, a sell-off down to the lows at 0.0215 will be very likely. Mark this range on your charts!

Disclaimer: This is not trading/investment advice!
Chart Source: https://poloniex.com/exchange#btc_eth
If you liked this article follow us on twitter @themerklenews and make sure to subscribe to our newsletter to receive the latest bitcoin and altcoin price analysis and the latest cryptocurrency news.
No Responses