NXT is currently in a long-term bear market that started in May of 2014. The digital currency is now trading at an all-time low, but there are some signs of stability. For example, the 0.0000155 level has now held as support about six different times since the start of November.

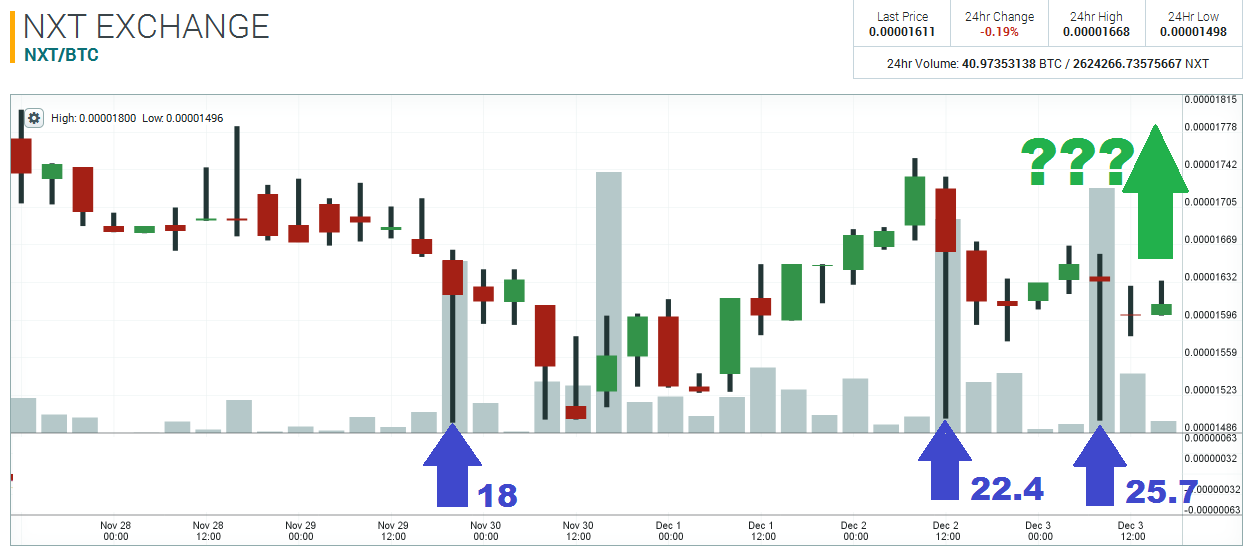
The 4-hour chart is showing several high-volume Pin candle formations. These bars have some of the highest volumes in the past 30 days, which is a very telling sign regarding the imbalance of supply/demand at 0.000015. There seems to be a lot of buyers between 0.000015 – 0.0000155. Pin candles – especially high volume ones – that occur at extreme lows, very frequently precede market reversals. I would not be surprised if there is a rally in the next few days.

Disclaimer: This is not trading/investment advice!
Chart Source: https://poloniex.com/exchange#btc_nxt
If you liked this article follow us on twitter @themerklenews and make sure to subscribe to our newsletter to receive the latest bitcoin and altcoin price analysis and the latest cryptocurrency news.
No Responses