The NEM digital currency was trading at 0.00000035 on December 31st of 2015, but in January, NEM exploded to all-time high of 0.00000189. The upsurge has been relentless, but the technicals are starting to show some weakness in the trend. The 0.0000015 level is now a significant pivot area as this level has acted as resistance on three occasions today.

There is also a clear Head & Shoulders pattern visible on the 30-minute chart. These patterns frequently appear at the top of market trends.

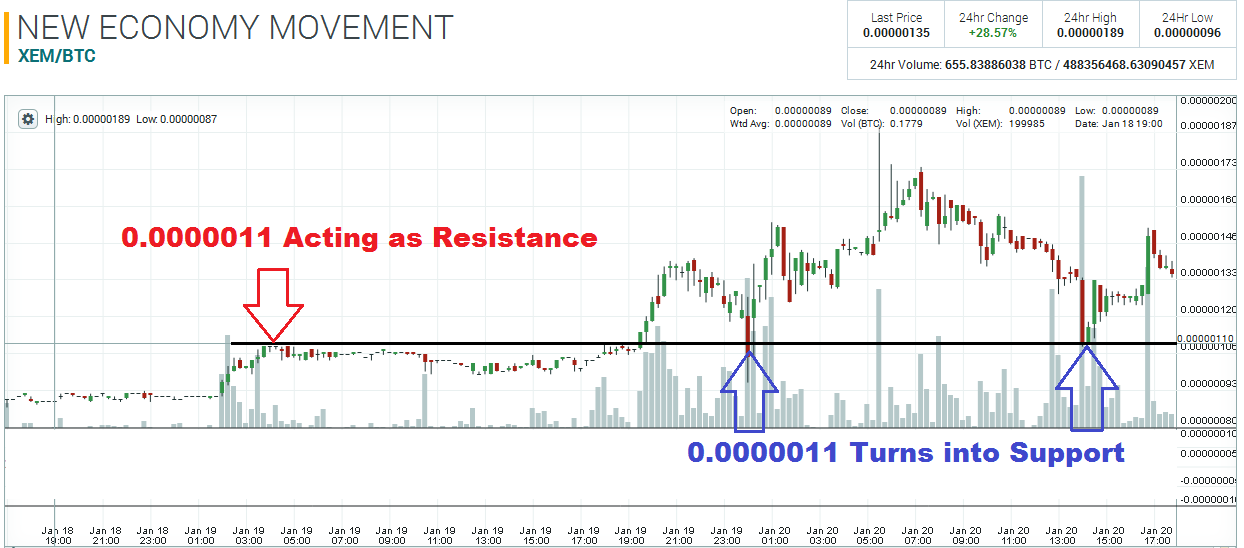
If the market can’t close above 0.0000015 and another sell-off takes places, 0.0000011 will likely provide some support. This level acted as resistance on January 16, and also twice as support today, so I would consider 0.0000011 to be of technical significance.

Disclaimer: This is not trading/investment advice!
Chart source: https://poloniex.com/exchange#btc_xem
If you liked this article follow us on twitter @themerklenews and make sure to subscribe to our newsletter to receive the latest bitcoin and altcoin price analysis and the latest cryptocurrency news.
No Responses