The big pivot zone at 0.00195 – which was outlined in the previous Monero article on 05/23/2016 – should still be watched, even though price is currently trading well underneath this level. On the 26th, this level was used as support/resistance; the 2-hour chart for that day show this quite clearly.

The following day, on the 27th, price made it underneath the big support level at 0.0018. And the Monero exchange rate has spent the last 6 days trading underneath this area, with multiple failed attempts at breaking above 0.0018.

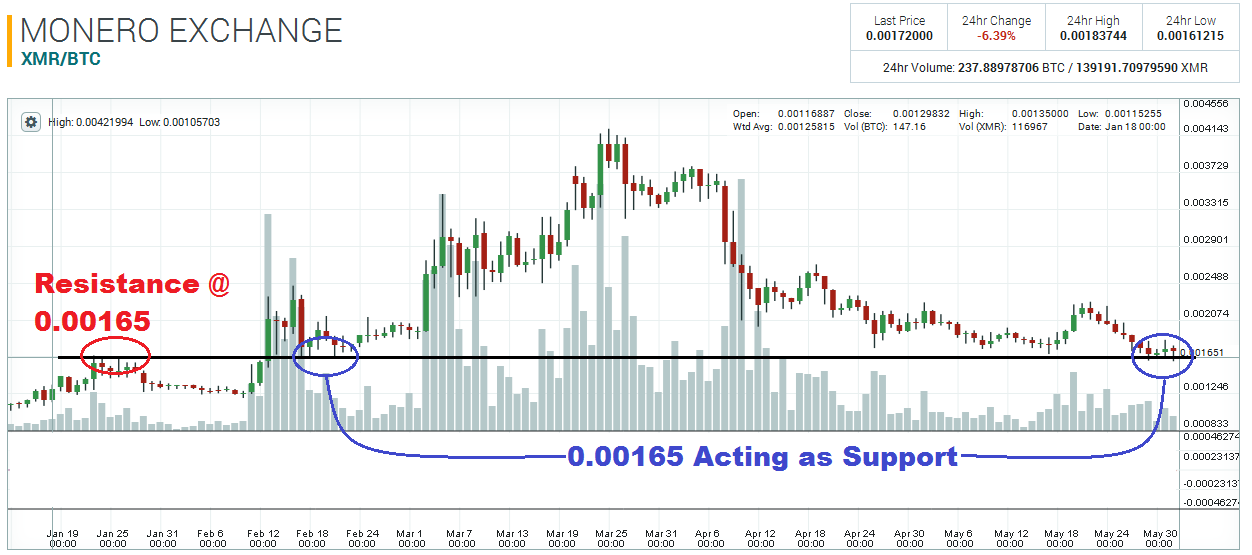
Despite the massive resistance at 0.0018, the market is also being supported on the bottom end by another major long-term pivot: 0.00165. The daily chart shows the significance of this area quite clearly; 0.00165 acting as resistance in January; twice as support in February. Is there really any question as to why this level has put a stop to the current downtrend? I think not! The 0.00165 pivot is a significant technical level that is being watched by many market participants.

It is clear that the market is now trapped between 0.0018 and 0.00165. It may be wise to wait until price breaks either of these huge pivot zones before making any trading decisions.
Disclaimer: This is not trading/investment advice!
Chart Source: https://poloniex.com/exchange#btc_xmr
If you liked this article follow us on twitter @themerklenews and make sure to subscribe to our newsletter to receive the latest bitcoin and altcoin price analysis and the latest cryptocurrency news.