In my prior Monero article I said that there weren’t any overt signals as to which way the market is leaning, but the situation seems to have changed. The 2-hour chart shows an ascending triangle formation, which indicated that pressure is building up. The trading range has been steadily narrowing since the 25th. I would not be surprised if price breaks above the 0.0021 area over the next few days.

The 0.00185 area – which I also outlined in the last article – has acted as support an additional two times. This level is now a significant pivot zone that should not be ignored.

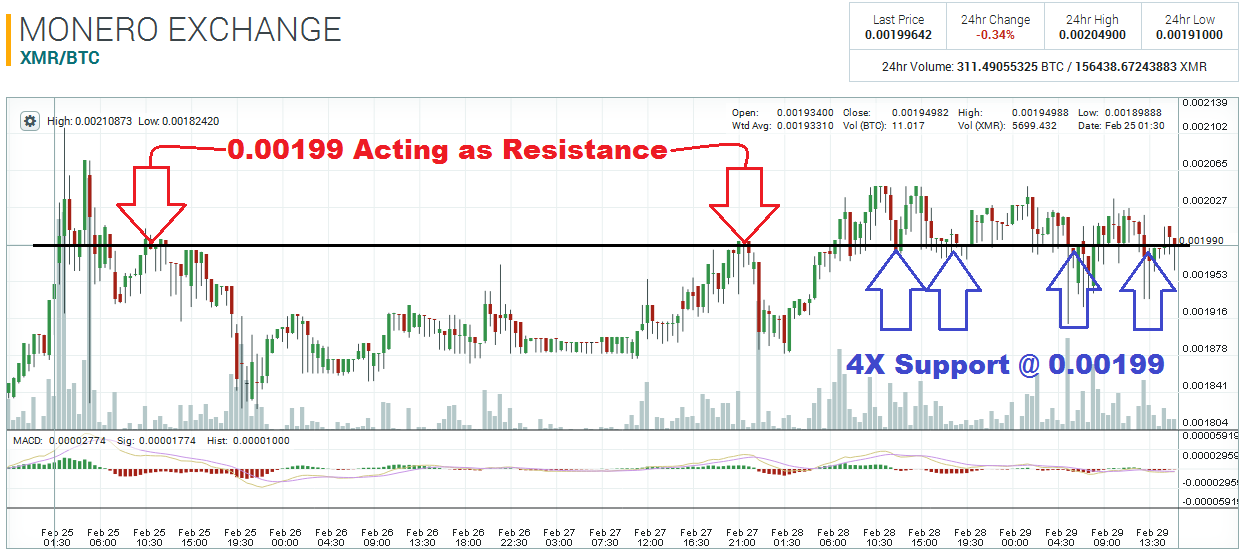
The 30-minute chart also shows that over the past three days the 0.00199 level has become an area of interest. Since yesterday, price hasn’t been able to trade under 0.00199 for any significant length of time. Each time price slips underneath this level, it bounces right back within a few hours. There seems to be a healthy amount of demand even though price is nearing the big resistance level at 0.0021!

Disclaimer: This is not trading/investment advice!
Chart Source: https://poloniex.com/exchange#btc_xmr
If you liked this article follow us on twitter @themerklenews and make sure to subscribe to our newsletter to receive the latest bitcoin and altcoin price analysis and the latest cryptocurrency news.
No Responses