As I pointed out in my last Factom technical analysis article – the 0.0025 area is of great technical significance. This level has supported the market a total of six times since the beginning of February. Price is currently trading right above this level, so the next few days will be very telling about the future direction of Factom.

The 0.0028 price level has also established itself as a key pivot zone this month. Since the beginning of February, this level has acted as resistance a total of six times. Between the 10th and 12th, 0.0028 provided support to the market about four times. Factom’s exchange rate is now essentially stuck between support at 0.0025, and resistance at 0.0028. Eventually one of these levels will be broken and the reaction will be furious.

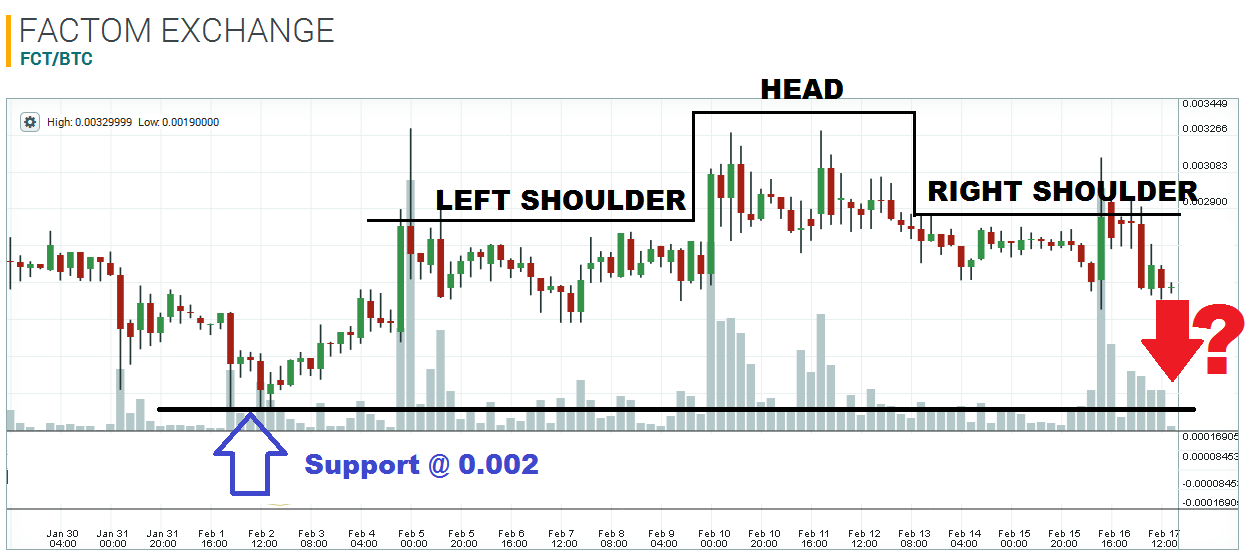
There aren’t any obvious technical signs right now as to which way the market will break, but the 4-hour chart is showing a Head & Shoulders pattern, which is suggestive of a break to the downside. If the support at 0.0025 gives way and there is a sell-off, the next major pivot area can be found 0.002. This level hasn’t been touched since the market bounced off this area on the 2nd of February, so 0.002 will likely act as support now.

Disclaimer: This is not trading/investment advice!
Chart source: https://poloniex.com/exchange#btc_fct
If you liked this article follow us on twitter @themerklenews and make sure to subscribe to our newsletter to receive the latest bitcoin and altcoin price analysis and the latest cryptocurrency news.
No Responses