After hitting an all-time high of 0.0035 on the 26th of January, the Factom digital token slid to a low of 0.0019 on the 2nd of February. Price has recovered somewhat in the past week, but the market is currently grinding around an important technical level. Of course I am referring to 0.0025. This area acted twice as support since the start of the year, and also three time as resistance during February. Today, price traded at 0.00234, so 0.0025 may now turn into resistance once again.

The higher time frame chart is also showing some bearish signals. To be a little more precise, the daily chart is showing a well-formed Head & Shoulders pattern, which also has a Pin candlestick on the right shoulder. These types of candles very frequently signal market reversals, especially when they form at extreme highs or at an important technical level.

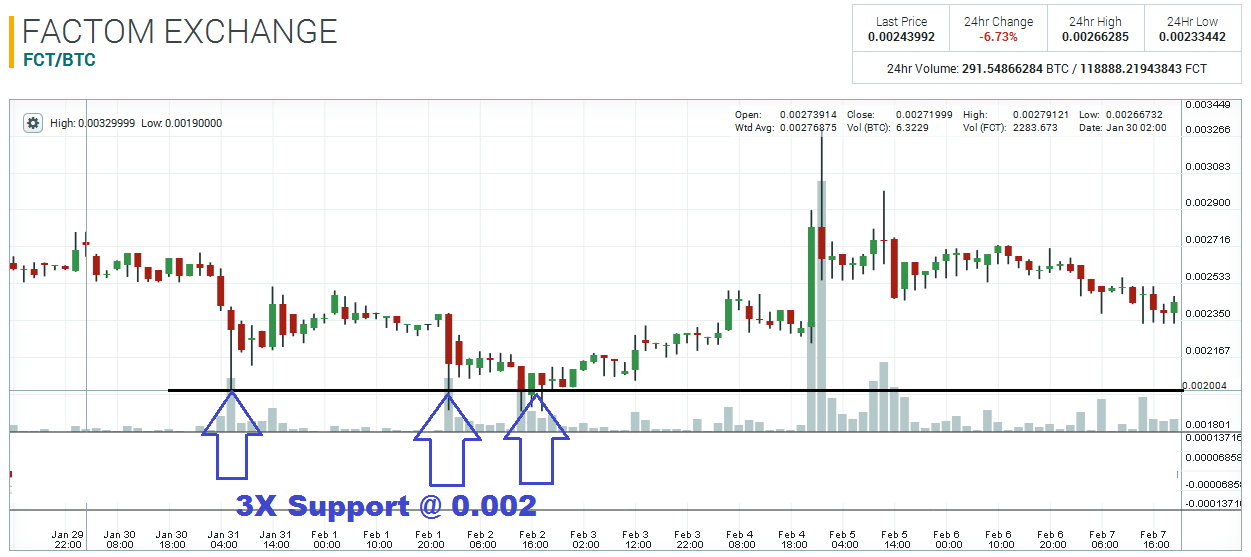
If there is sell-off over the next few days, I would expect price to encounter some support at 0.002. The market did not have enough momentum to break through this price level at the end of January and at the beginning of February, so it is very likely that price will be supported at 0.002!

Disclaimer: This is not trading/investment advice!
Chart source: https://poloniex.com/exchange#btc_fct
If you liked this article follow us on twitter @themerklenews and make sure to subscribe to our newsletter to receive the latest bitcoin and altcoin price analysis and the latest cryptocurrency news.
No Responses