Since the 29th of April, the Ethereum digital currency has staged two impressive rallies , but price has retraced now and some pivot zones are visible on the lower time frames. For instance, over the past few days, the 0.0205 level acted as resistance on two occasions; once on April 30; again on May 2. Today, ETH is trading just above this area and given its prior history – 0.0205 may now turn into support.

If 0.0205 turns into support today and the market starts to rally again, the pivot at 0.0218 – which is clearly visible on the 15-minute chart – will most likely come into play. This level acted as support about four times in the past two days, so this area can turn into resistance quite easily!

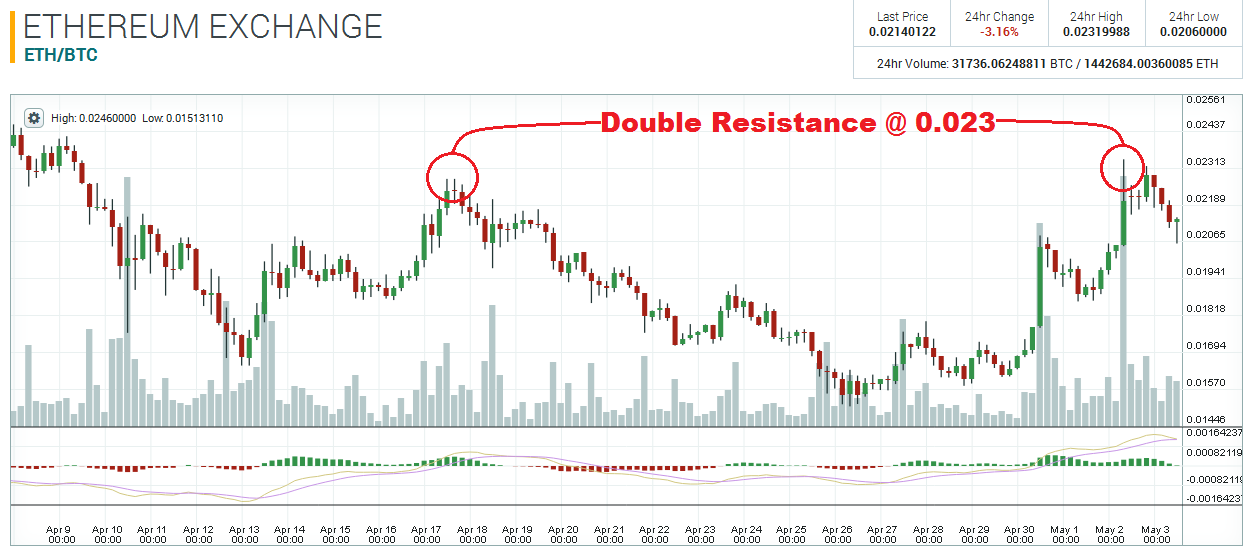
However, if 0.0205 doesn’t halt the current retracement, the next major pivot zone can be found at 0.019! This level was used many times as support/resistance in April, and it seems that this zone is still being respected. On the 1st of May, 0.019 act as support and set the stage for the second rally that took price all the way to 0.023, the previous high from the 17th of April.


Disclaimer: This is not trading/investment advice!
Chart Source: https://poloniex.com/exchange#btc_eth
If you liked this article follow us on twitter @themerklenews and make sure to subscribe to our newsletter to receive the latest bitcoin and altcoin price analysis and the latest cryptocurrency news.