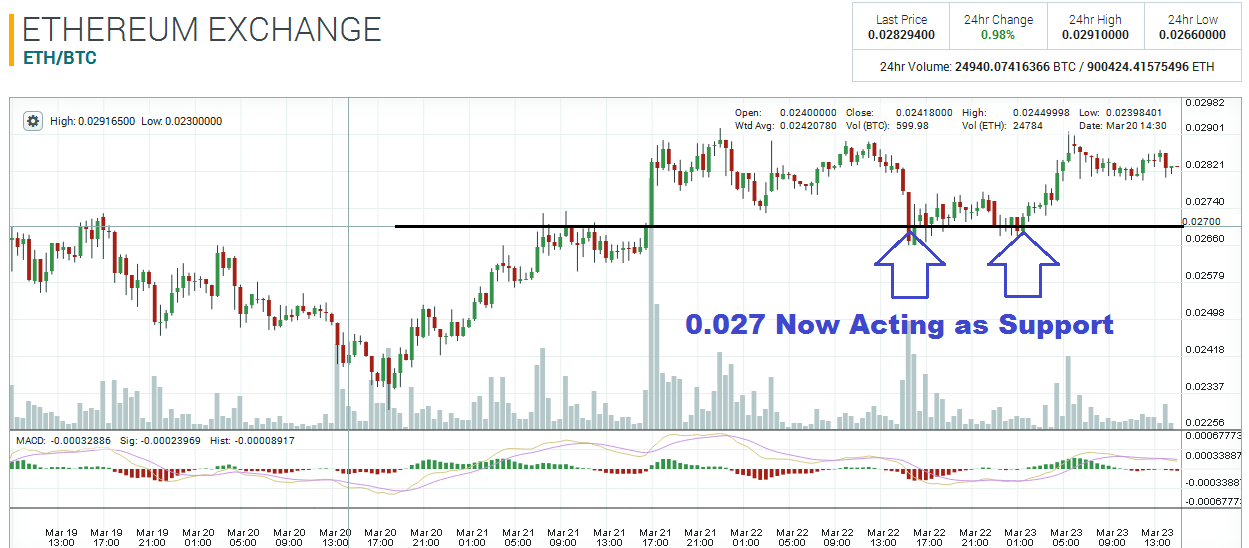
The giant barrier at 0.027 that I outlined in my previous Ethereum technical article, was finally broken on Monday. Since the 21st, the 0.027 pivot has started acting as support. Yesterday, when price retraced back down to 0.027, this area prevented price from trading lower and the market bounced higher.

In my previous ETH article, I said that if the 0.027 area was broken, the market would probably rally to 0.029, and that is exactly where the market stalled when it jumped above 0.027 on the 21st. So, since the 21st, the market has been bouncing around between 0.027 and 0.029!

At this point, there are no technical signs that show which way the market is leaning, so it’s hard to tell which one of these two pivot zones will be broken first. If there is enough momentum to break above 0.029, a rally up to 0.033 – the swing high from March 16 – would not be out of the question. On the other hand, if there is a sell-off that pushes price below the big pivot at 0.027, I would think that price would continue sliding all the way down to 0.024 – the other significant pivot level.
Disclaimer: This is not trading/investment advice!
Chart Source: https://poloniex.com/exchange#btc_eth
If you liked this article follow us on twitter @themerklenews and make sure to subscribe to our newsletter to receive the latest bitcoin and altcoin price analysis and the latest cryptocurrency news.