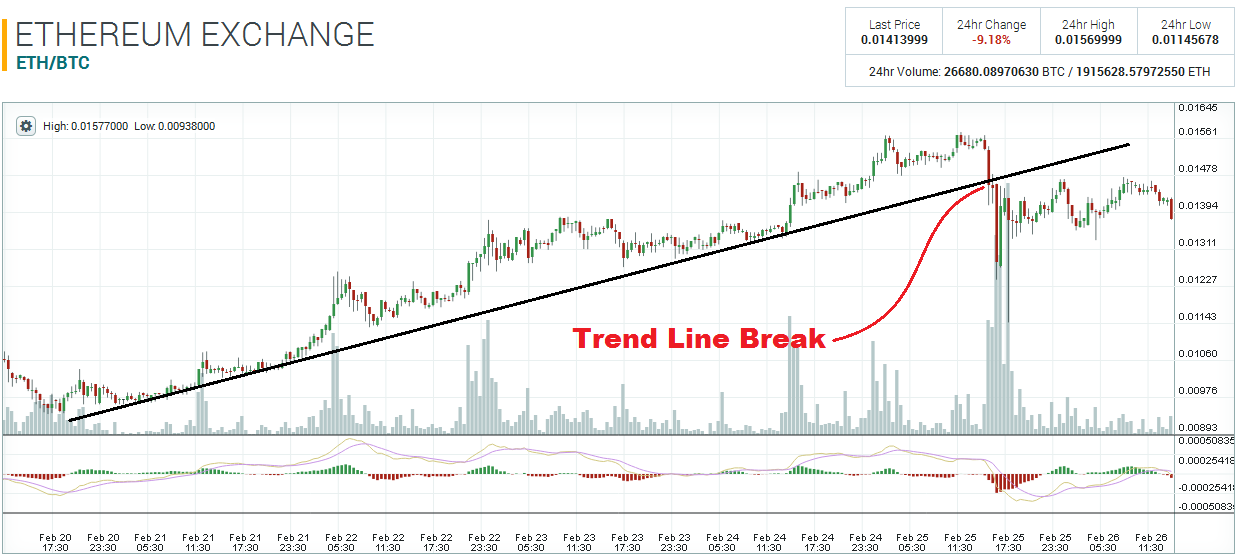
Ethereum was trending upward in a steady fashion since the 20th of February, but yesterday’s savage sell-off did some major technical damage. For starters, the trend line – which the market bounced from multiple times – was broken yesterday. So, technically speaking, the bull market has ended.

Also, price made its way under the 0.01475 pivot. This level was used as resistance on the 24th, and as support on the 25th, however, this level acted an additional two times as resistance today, so 0.001475 has now become a major pivot zone. Unless there is enough buying interest to move price above 0.001475, another sell-off is very likely.

Since the big break yesterday, price has been grinding away into a tighter range. A triangle formation is clearly visible on the 15-minute chart. This is an indication that pressure is building up in the market again, and that another large move is imminent.

Interesting Observation:
The second sell-off yesterday, which pushed price all the way down to 0.0114 in the space of several minutes, had the highest volume since Ethereum started trading on Poloniex. That 30-minute candle registered 4161.6 BTC!!! Insider dumping?? Big whale dumping??

Disclaimer: This is not trading/investment advice!
Chart Source: https://poloniex.com/exchange#btc_eth
If you liked this article follow us on twitter @themerklenews and make sure to subscribe to our newsletter to receive the latest bitcoin and altcoin price analysis and the latest cryptocurrency news.
No Responses