Since hitting a high of 0.007321 on the 26th of January, Ethereum has been trading in an increasingly tighter range. The 4-hour chart showing a very distinct triangle formation. This indicates that pressure is building up and that a violent break may be imminent.

So, why is price having such a hard time getting above 0.0067/0.0068. This price range actually goes all the way back to August of 2015, when the market used this level as resistance. Ethereum has not traded near this area since that time. The 0.0067-0.0068 is a very important zone from a technical perspective and many traders are likely aware of this fact. If ETH can make it above 0.0068 and trade there for a day, then this level is very likely to turn into support.

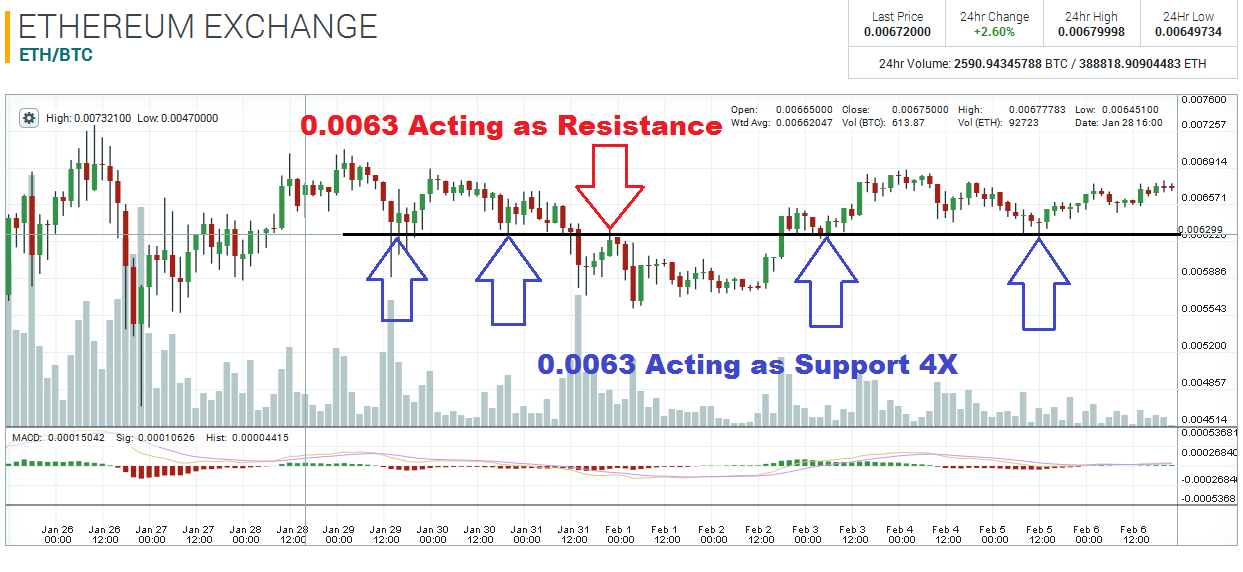
While the 4-hour chart does not reveal it, the 2-hour chart is showing that 0.0063 has become an area of interest over the past week. This price level has acted as support on four occasions, and once as resistance. Definitely an area to be mindful of!

Disclaimer: This is not trading/investment advice!
Chart Source: https://poloniex.com/exchange#btc_eth
If you liked this article follow us on twitter @themerklenews and make sure to subscribe to our newsletter to receive the latest bitcoin and altcoin price analysis and the latest cryptocurrency news.
No Responses