Ethereum has been trading in a sideways market for the past few days, with very clearly defined pivot zones. The most contested pivot area is 0.00345. This price level acted as resistance about three times between the 15th and 17th. Price broke above 0.00345 on the 18th of January, and this area then turned into support, propping-up the market about three times on the 18th and 19th. This pivot zone is clearly a major battleground for traders.

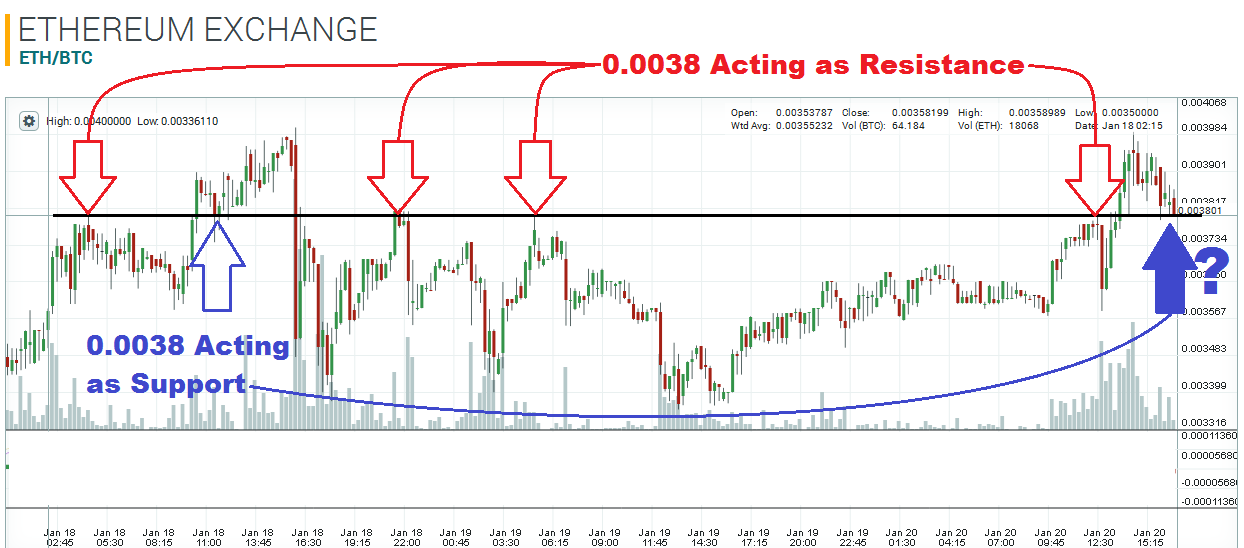
There is another pivot area that isn’t visible on the 2-hour and 4-hour charts, but is quite obvious on the 15-minute chart – 0.0038. This price level acted as resistance about four times in the past two days and price is currently trading above this area, therefore, I wouldn’t be surprised if 0.0038 now acts as support. If the market breaks below 0.0038 and closes lower, I would expect 0.0038 to turn into resistance again and further selling to take place. So, watch what happens around this pivot zone today.

Disclaimer: This is not trading/investment advice!
Chart Source: https://poloniex.com/exchange#btc_eth
If you liked this article follow us on twitter @themerklenews and make sure to subscribe to our newsletter to receive the latest bitcoin and altcoin price analysis and the latest cryptocurrency news.
No Responses