Since the big trend-line break on the 10th of December, the Ethereum digital currency has managed to power through some key levels on its way up. The 0.0021 area – which stalled the market after the initial trend line violation on the 10th and again on the 11th – turned into support when price broken above it on the 12th. This level is now a pivot zone and is very likely to act as support again.

Actually, the price band between 0.0021-0.00215 is one massive pivot area. The 0.00215 level has supported the market on four different occasions since December 12.

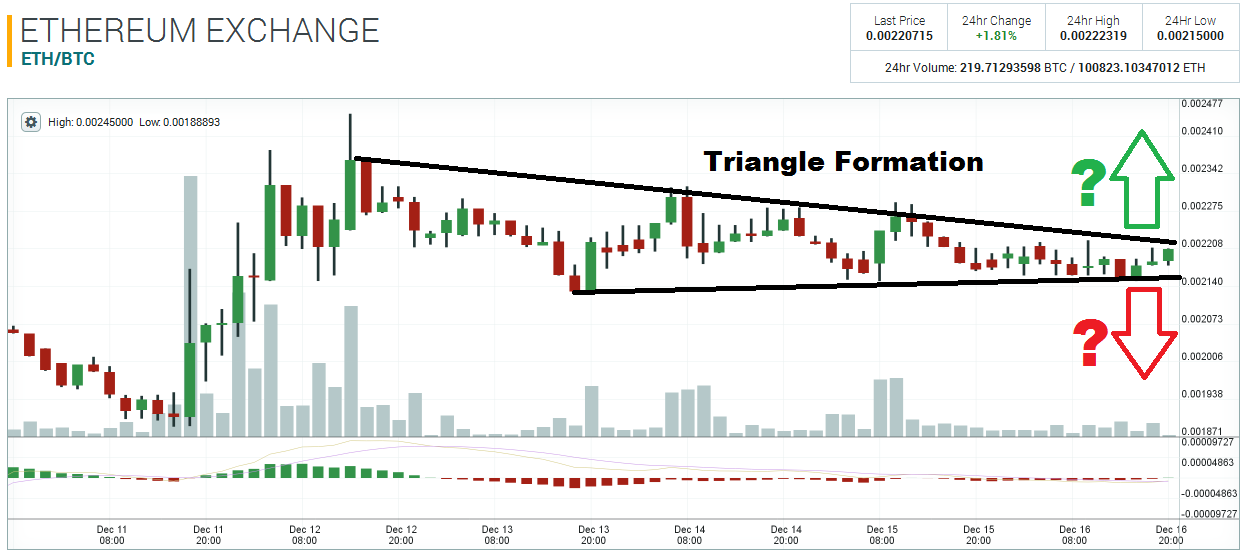
So, the big dilemma is: when is price going to break and which way?
The triangle formation – which is visible on the 2-hour chart – is showing that pressure has been building up for the past few days now. The trading range is getting compressed into a tight space, and this is pointing to an imminent break. There is a lot of support underneath the triangle (0.0021-0.00215), so it would seem that a bullish bias here is warranted.

Disclaimer: This is not trading/investment advice!
Chart Source: https://poloniex.com/exchange#btc_eth
If you liked this article follow us on twitter @themerklenews and make sure to subscribe to our newsletter to receive the latest bitcoin and altcoin price analysis and the latest cryptocurrency news.
No Responses