
Chainlink Price Analysis (LINK/USD)
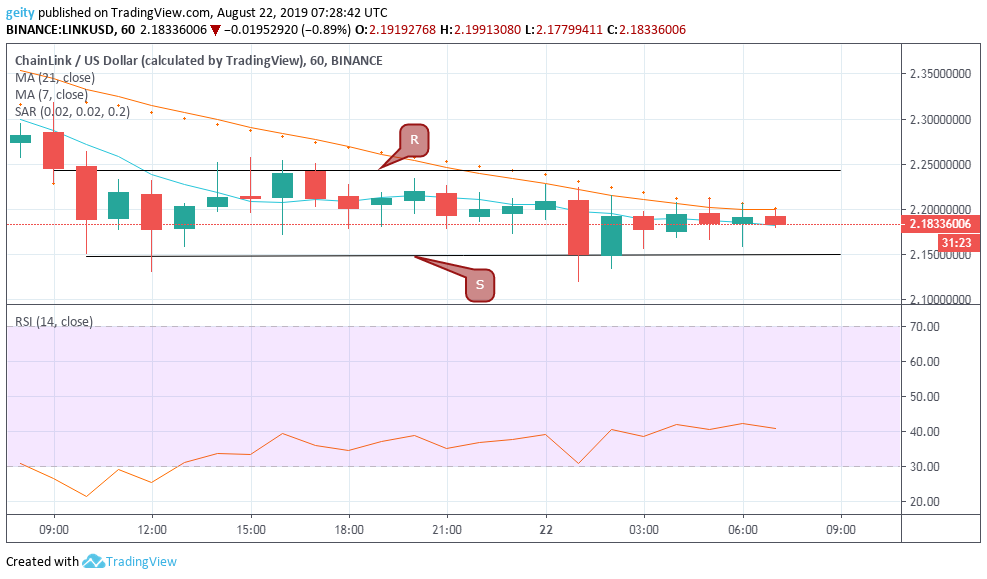
Yesterday decline continues today as the market of LINK/USD pair records a down surge. LINK seemed to have succumbed to the selling pressure that has formed a strong bearish trend line over the last 24hrs. The downside move began the session trading at $2.2455, where it later escalated to $2.1496 that translates to a dip of 2.8% over the intraday.
The market fluctuated dip down yesterday that brought the market to trade on the oversold zone before slightly gaining momentum to trade horizontally below $2.2423 resistance level. In addition, the support level was found near $2.1496.
Most technical indicators pointed at a bearish outlook, the 21 day MA gravitated above the 7 day MA over the last 24hrs. The parabolic SAR was also seen above the price that confirmed a downtrend thus indicated a sell signal.
Chainlink Price Prediction (LINK/USD)
The RSI indicator has maintained its position below level 50 that indicates intense selling pressure. A break below $2.1000 may signal a downward move continuation. However, if the bulls up there move a break above 2.5000 may result in to a bullish outlook.
Bitcoin SV Price Analysis (BSV/USD)
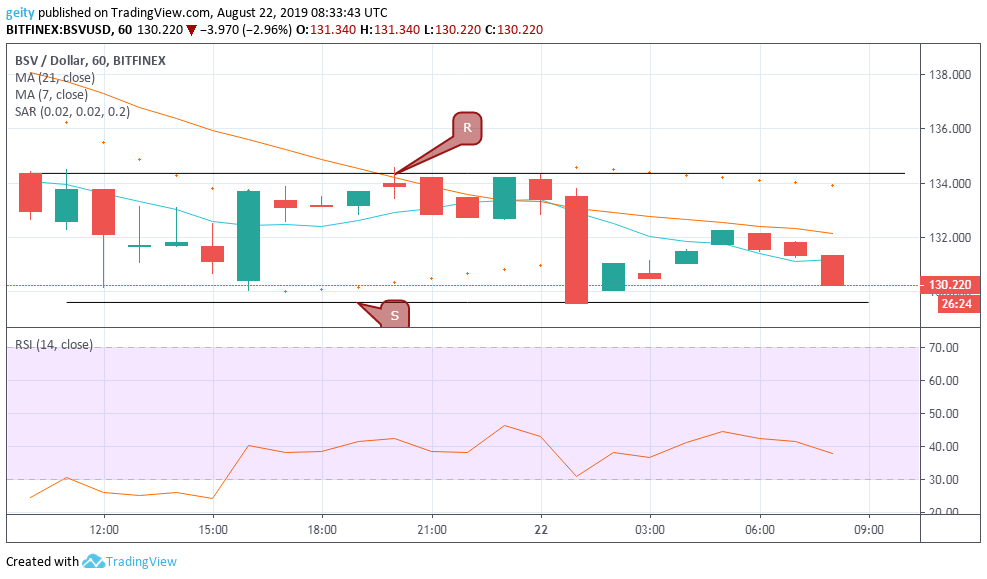
BSV/USD pair has also exhibited a bearish outlook, having escalated from the opening price of $132.940 to currently value at $130.220. This showed that BSV has down surged by 2.05% over the last 24hrs. However, the trend is sideways trading between $134.354 resistance level, and $129.600 support level.
At the beginning of the hourly chart, the price seemed to be on the negative territory, but buyers seemed to be struggling to recover the momentum. The bullish divergent candle that emerged at around 16:00 reflected this. The 21day MA closed above the 7 day MA, and the RSI indicator seemed to be heading south that suggest that sellers have overcome buyers.
Bitcoin SV Price Prediction (BSV/USD)
The parabolic SAR indicator is at the moment above the price action that signals a bearish sign. Thus traders should go short when the price manages to break the $129.600 level. Take profit should be set at $120.000.
Monero Price Analysis (XMR/USD)
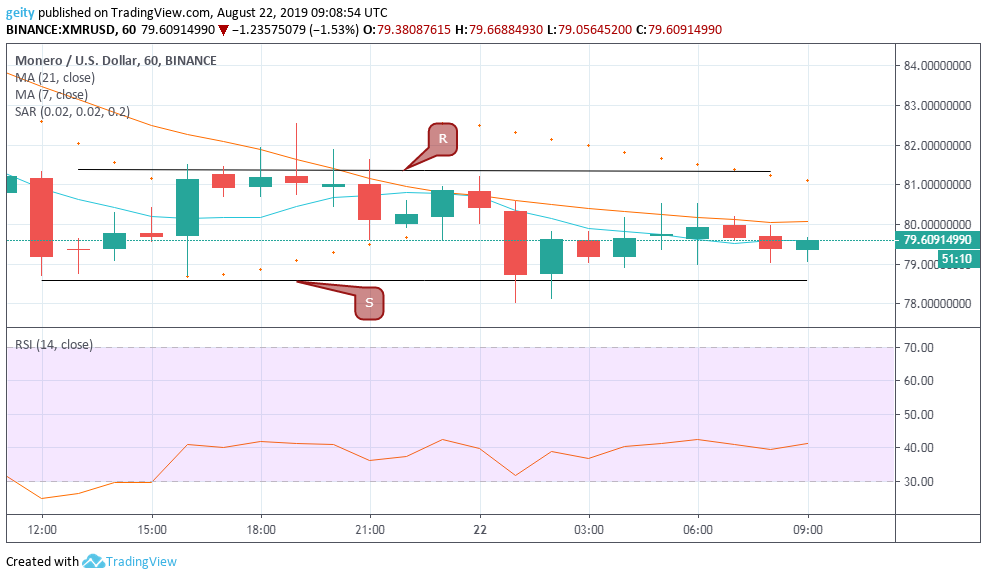
XMR/USD has also faced a bearish pressure that has been indicated by the 21 day MA that gravitated above the 7 day MA. Despite the overall bearish outlook, the trend is sideways since the price move has been horizontally mainly because there is a balance between the buyers and the sellers. The coin could not manage to fight resistance level beyond $81.3357 but find support near $78.5910.
The RSI indicator that is currently trading below level 50 signaled an increase in selling pressure. XMR was trading at $79.2027 that later had a low swing at $78.7541 before gaining slightly to $79.6091.
Monero Price Prediction (XMR/USD)
The parabolic SAR gives investors a sell signal since the dots are currently above the candles. Resistance level near $77.000 and support level near $58.000 is likely. That is, the price manages to breach $78.5910.