BitShare has been steadily rising since the start of this year, but the technical patterns on the 30-minute chart are showing some bearish signals. For starters, there is a clear Head & Shoulders pattern discernible on the 30-minute chart and a massive pivot zone at 0.000008. This level has been used several times as resistance/support over the past few days. Price is currently trading under this zone, therefore, there is a good chance that the market may see further selling from where it is trading now.


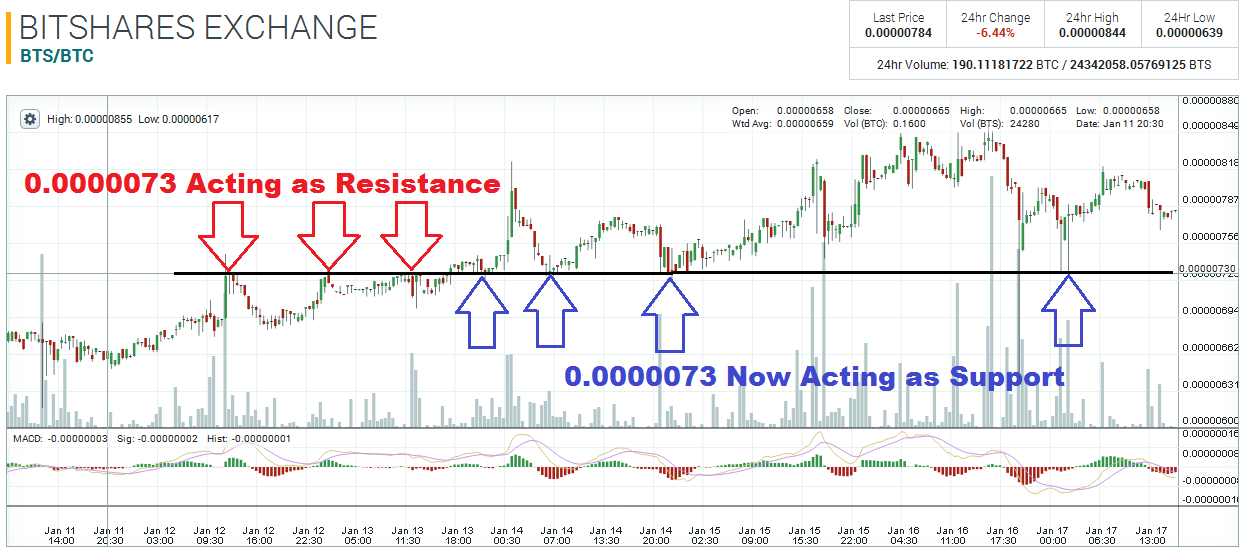
There is another major pivot area at 0.0000073. This level acted as resistance on three occasions around the 12th of January. Price managed to close above 0.0000073 on the 13th, and this level has acted as support about four times since then. I would recommend to to keep an eye on this level!

Disclaimer: This is not trading/investment advice!
Chart source: https://poloniex.com/exchange#btc_bts
If you liked this article follow us on twitter @themerklenews and make sure to subscribe to our newsletter to receive the latest bitcoin and altcoin price analysis and the latest cryptocurrency news.
No Responses