What’s up traders,
Back again on a Tuesday, and bitcoin is looking weak.
First thing’s first, let’s start our price analysis on a daily chart and look at this 14 day simple moving average. This trick was taught to me by a fund manager in the Forex markets, only he would use the 10 day moving average to capture 2 weeks of data (weekends are closed in FX). Since this crazy bitcoin market is open 24/7, our weeks include the weekends.

Bitcoin 14 Day MA
In the above chart we can see that the 14 day moving average offers a dynamic level of support and resistance. It also offers a sort of equilibrium in the market. When bitcoin’s price gets too far away from this 14 day moving average, it is likely to snap back. Think of equilibrium like an unstretched rubber band. When price gets pulled too far in one direction, it increases the ability for it to snap back toward the other direction.
When price is too far away from the 14 day moveing average, we have to be careful of a correction. So, it’s good to know that we may be dangerously far away from “equilibrium”. On the other hand, we can’t forget what the famous economist John Maynard Keyes said:
The markets can stay irrational longer than you can stay solvent
…So we have to use more tools in our analysis than just a simple moving average.
Moving down to the hourly chart, I’ve marked some key price levels for bitcoin:
bitcoin’s daily and 4 Hour key price levels
The blue price lines are 4 hour levels and the red price lines are daily levels. It is important to use these higher time frame support and resistance levels because price is more likely to respect support and resistance on higher timeframes.
Bitcoin has broken that 219.44 4H price level, and took out the old low in the process. If bitcoin cannot regain upward momentum, it is headed to that daily level at around 214 and may potential touch the 4H level at 205.
One last bitcoin chart for the bears:
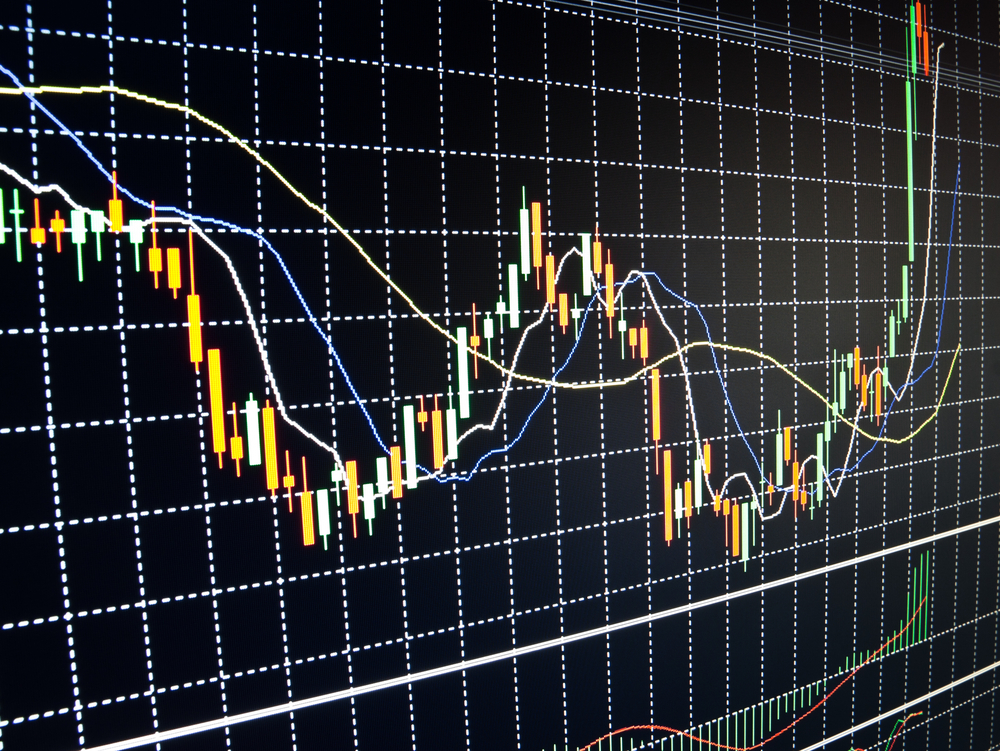
Bitcoin hourly price analysis
Here, we can see that bitcoin has a habit of breaking previous lows while failing to make higher highs. This is the very definition of a bear trend and will continue as long as bitcoin cannot break old highs.
Another noteable fact to pull away from this chart is the shooting star doji that price made when it tried to reach up and reclaim the 4H 219.44 level. A shooting star doji occurs when bulls buy up price to make a nice green candle, but then bears overwhelm them and sell all the way back down and then more. This is often a sign of weakness for bulls who were unable to hold at a certain price level, and the heavy rejection implies bears are still in control.
That’s all I got for today, until tommorrow….
Good luck, good trading
If you liked this article don’t forget to follow us on twitter @themerklenews and subscribe to our newsletter!
No Responses