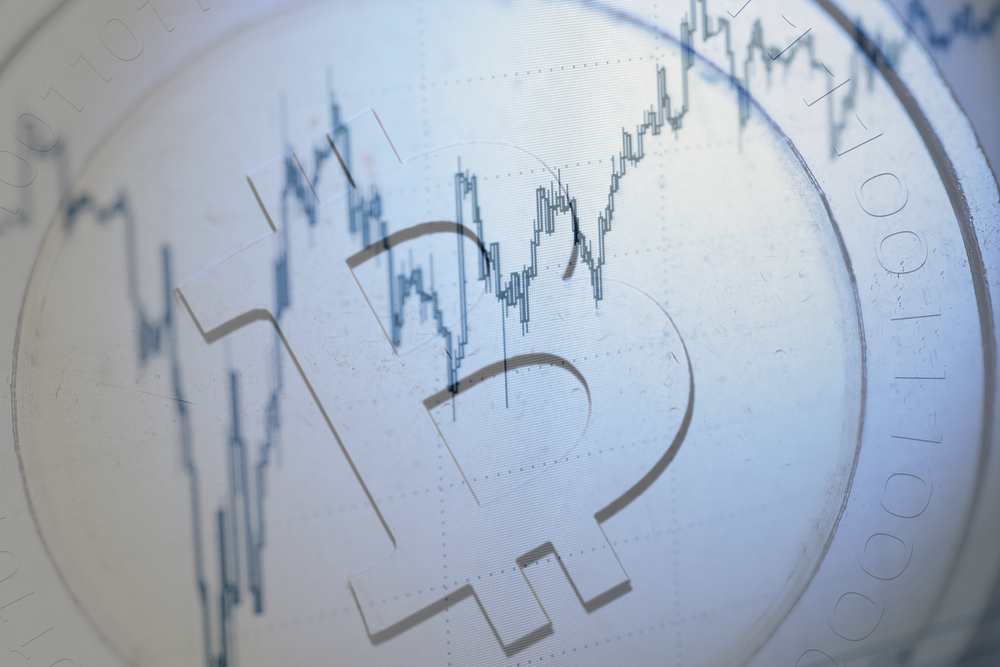
This week began with a round of dumping which sank the price $6 from $378 to the current level of $372. In our last technical analysis we discussed whether or not the sudden price increase to $390 last week was yet another pump or was the result of true market movement. The poll conducted in that analysis suggested that most readers believed that the sudden price hike was due to legitimate market movement. Looking back on last week’s chart we can see that it was yet another pump and dump reminiscent of the pump on January 20th which launched the price over $50.

Chart from Bitcoinwisdom.com
The daily chart above shows a clear downtrend which suggests the market may retest the $370 support line. Not only were there 2 unsuccessful pumps, but the market also broke through the $370 support line a few times. The market clearly rejected $390 on US exchanges meaning that any sudden price movement above $400 is highly unlikely.
Charts tell different stories based on the time frame used. If we zoom out to a monthly chart we can see that Bitcoin is exhibiting a bull market. IvanLabrie from tradingview suggests that the price is heading higher, explaining:
Bitcoin has been in a monthly uptrend for some time, but still hasn’t reached the target.
Currently the weekly chart has given signs of a potential decline, but said decline is now failing to confirm the downside, giving way to a potential long trade. Currently there is a possibility to trigger a weekly time at mode uptrend continuation signal, which would suggest price could reach 3720 ($560), or even 5097 ($775) in 9 weeks or less.
While such high targets may seem outrageous looking at the monthly chart Bitcoin has been in a five month uptrend, if that momentum doesn’t stop, the market may well reach those levels.

Chart from Bitcoinwisdom.com
fluffy1337 from BitcoinMarkets points out that due to long positions being closed in the West, not so many positions closed in China, and not much price movement, suggests that there is less “forced fuel” or margin calls. When people start playing with leverage and margin calls, the market starts exhibiting buy or sell pressure depending on the positions opened.
![]()
Data from Bitcoinwisdom.com
Currently there is an eleven dollar difference between the West and the Chinese exchanges. This spread may be the result of margin calls not being closed in China while the opposite is happening out West.
fluffy1337 also suggests that due to the spread of longs, if the price drops there might be more sell pressure than usual, not only because the recent dumps have been absorbed at a much higher price than usual but also due to new buyers who have bought in when the price was much higher than it is currently:
Although the new buyers have bought in much higher than the previous ones, in the event of a price decline there will be actual losses rather than simply “less profit”.
If you liked this article follow us on twitter @themerklenews and make sure to subscribe to our newsletter to receive the latest bitcoin and altcoin price analysis and the latest cryptocurrency news.
No Responses