
It hasn’t been a good day for the Bitcoin price as of today. A lot of value has been lost in very quick succession, yet no one seems to know where this downtrend will end exactly. With some basic technical analysis, it quickly becomes apparent numerous key support levels have been broken in quick succession. This free fall will end eventually, but for now, it will seemingly continue.
A Retrace was Completely Expected
It is always crucial to keep an eye on how fast a cryptocurrency market moves up or down. In the case of Bitcoin, the recent uptrend has been both impressive and violent at the same time. Such strong gains in quick succession cannot go by without a hefty correction of some sorts. That correction is currently ongoing, as the actual bottom may sit a bit lower compared to the current price.
As is usually the case when it comes to volatile cryptocurrencies, the current trend can turn around on a dime. There have been numerous attempts at reverting the Bitcoin trend today, albeit all of them have failed miserably so far. The market is clearly in a massively oversold state, but since there are not enough buyers willing to push the price higher, the current trend could remain in place for a few more hours. For all one knows, the current resistance levels are broken as swiftly as they were when the levels acted as support. Unpredictability is what makes these markets so appealing.
BTC/USD Technical Analysis
There are some interesting aspects of the BTC/USD chart when looking at the one generated by the Bitstamp exchange. Perhaps the oddest fact is how this is only one of the only trading platforms to see the Bitcoin price drop as low as $6,168 which is well below the lowest price of other exchanges. Why the value hit such a low value, remains rather unclear at this time. It is possible there simply wasn’t enough liquidity to keep the order book afloat, although it does raise a lot of interesting questions.
When looking at the actual technical indicators, a very worrisome trend becomes apparent. Albeit the chart below might label too many levels as “crucial”, there are all former resistance levels of the past few weeks. Every single one of those levels was turned into perceived support lines, albeit last night’s retrace shows that is not necessarily the case. The Bitcoin value got dumped through at least eight “support” levels in very quick succession, which still leaves a lot of people puzzled at this stage.
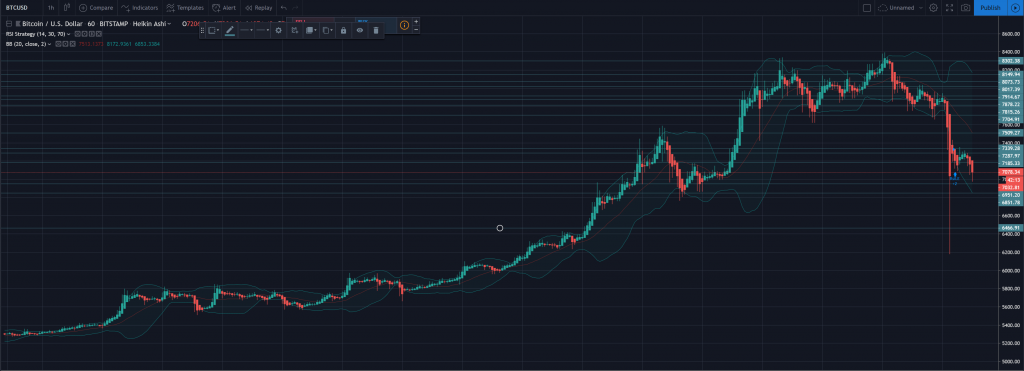
Based on the recent Bitcoin price trend, one of the key resistance levels sat at $7,509, followed by further support at $7,288 and $7,185. Further down the line, the $6,951 level wasn’t expected to come into play at this time, yet this massive dump broke through that with relative ease as well. It would now appear the next major line of support sits closer to the $5,188 level, although it seems unlikely another $2,000 dump will materialize so shortly after the first. Even so, one never knows what might happen next.
For the time being, Bitcoin seems to lean toward retesting the $6,951 support level again, as the selling pressure has not relented yet. If a bounce were to occur, however, a push to $7,287 would not be impossible. One could argue a double bottom has begun forming near $7,075 but there is a chance a third attempt at breaking support will occur over the course of the weekend. If $6,951 falls short, there is additional support roughly $100 lower. This weekend will undoubtedly prove very interesting in many different ways, albeit the end result remains to be determined.
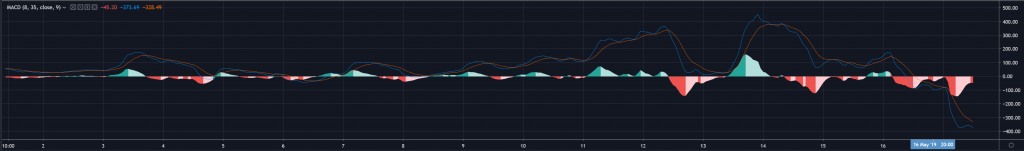
The MACD Looks way Oversold
Even when using some of the basic indicators TradingView has to offer, it doesn’t require much effort to see Bitcoin is -v theoretically – in a massively oversold state. From a short-term perspective, this might not yield any real changes ahead of the weekend. In the longer term, however, this could hint at a major bounce potentially materializing. Earlier today, the oversold territory was way deeper, yet the subsequent uptrend did not last too long. This seems to confirm this negative spiral is still in play today, and may continue to be for a few more days.
The Elder Ray Indicator Looks Bearish
A healthy market will see plenty of bulls and bears engaging in a tug-of-war to control the price. For Bitcoin, the Elder Ray indicator – which highlights the ratio between bears and bulls – shows there is nothing to get excited about as of right now. Both ratios are well below 0, with both of them heading to the -100 level. As such, it seems unlikely any real improvements will occur for the foreseeable future.
![]()
Disclaimer: This is not trading or investment advice. The above article is for entertainment and education purposes only. Please do your own research before purchasing or investing into any cryptocurrency.