Bitcoin Price Analysis (BTC/USD)
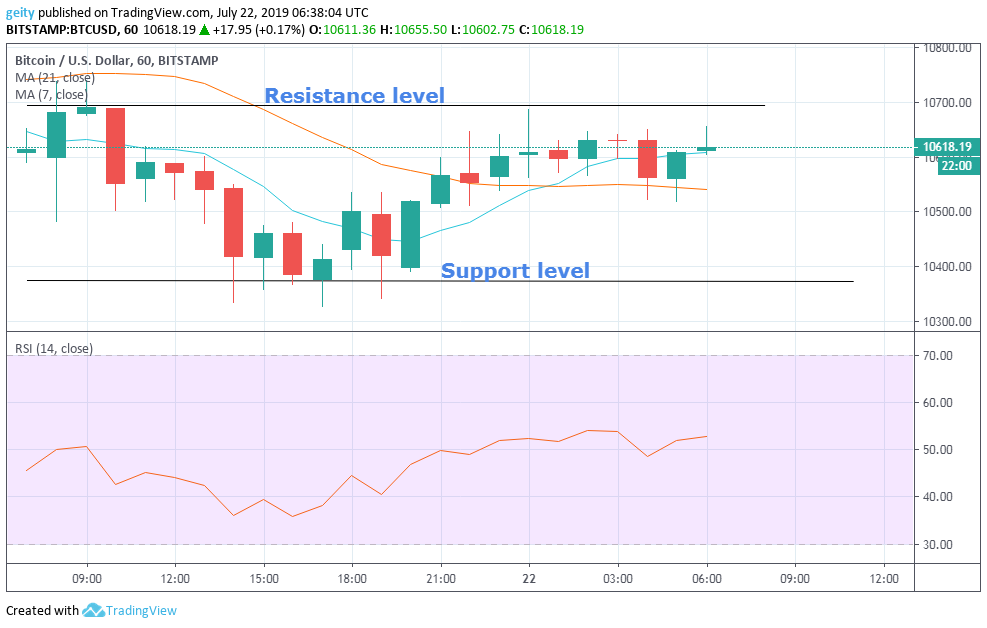
Over the last 24hrs, BTC/USD pair has been trading on a sideways market. On an hourly chart, the horizontal channels that are acting as the pair’s price resistance level $10694.22 and support level $10374.41 that confirmed the sideways trend.
An upward price rally was encountered, with the 7 day MA currently situated above the 21 day MA that indicated a bullish sign. BTC/USD has slightly gained by 0.04% over the past 24hrs. Additionally, it began trading at $10618.19 and is currently at $10618.19.
The Relative Strength Index indicator seemed to have gained momentum since it has moved from a low of 36 to a high of 52 that showed an increase in buyouts. The RSI indicator is currently heading north, which indicates increase confidence in the coin by investors.
Bitcoin Price Prediction
At the press time, almost all the indicators are pointing towards a bull sign. The 7 day MA is above the 21 day MA. The RSI indicator is also heading north which, signals further bullish momentum. New targets should be set at $10700.
Litecoin Price Analysis (LTC/USD)
LTC/USD pair has also been dominated by a sideways trend with a temporary resistance and support level being defined at $100.43 and $97.24 respectively. The RSI indicator that was seen hovering in between level 60 and 40 reflected a sideways market momentum.
Aside from a sideways trend, the pair’s price market is bullish since it has been supported by the 7 day MA that is currently above the 21 day MA that signaled a bullish trend. LTC has upsurged by 0.25% over the last 24hrs, having begun trading at $98.92 and is currently at the rate of $99.17. That showed positive investors sentiments. The RSI indicator is currently trading flat showing that the market is currently lacking momentum.

Litecoin Price Prediction
Currently, the 7 day MA is above the 21 day MA that signals further bullish momentum. New targets should be set at $100.50, whereby the temporary resistance level $100.43 is most likely to be broken.
Ripple’s XRP Price Analysis (XRP/USD)
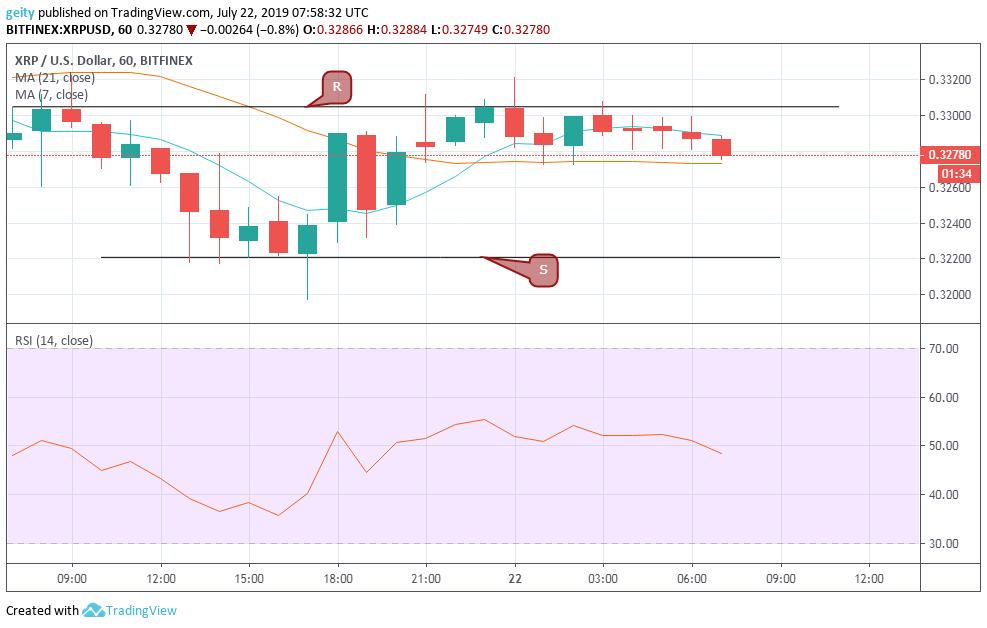
XRP/USD has also traded sideways over the entire intraday. The horizontal channels confirmed the sideways trend. XRP began trading at $0.33035 that was followed by a massive dip that fluctuated the price down to a low of $0.32175. The pair’s price later saw a short-term period of consolidation below the support level $0.032208.
XRP/USD pair later gained momentum and was pushed up above the resistance level $0.33051 before embarking to a steady flow. This placed XRP to its current price of $0.032780. The RSI indicator was seen heading south during the last 3hrs, that indicated reduce buyouts. Apparently, despite an overall bullish sign, that was supported by the 7 day MA that is currently above the 21 day MA. XRP is slightly down by 0.8% that showed negative investors sentiments.
Ripple’s XRP Price Prediction
The Relative Strength Index indicator is at the moment heading south that signals incoming bearish rally in the next few hours. New targets should be set at $0.32500.
Cryptocurrency Charts By Tradingview
Disclaimer: This is not trading or investment advice. The above article is for entertainment and education purposes only. Please do your own research before purchasing or investing into any cryptocurrency or digital currency.