
Bitcoin Cash Price Analysis (BCH/USD)
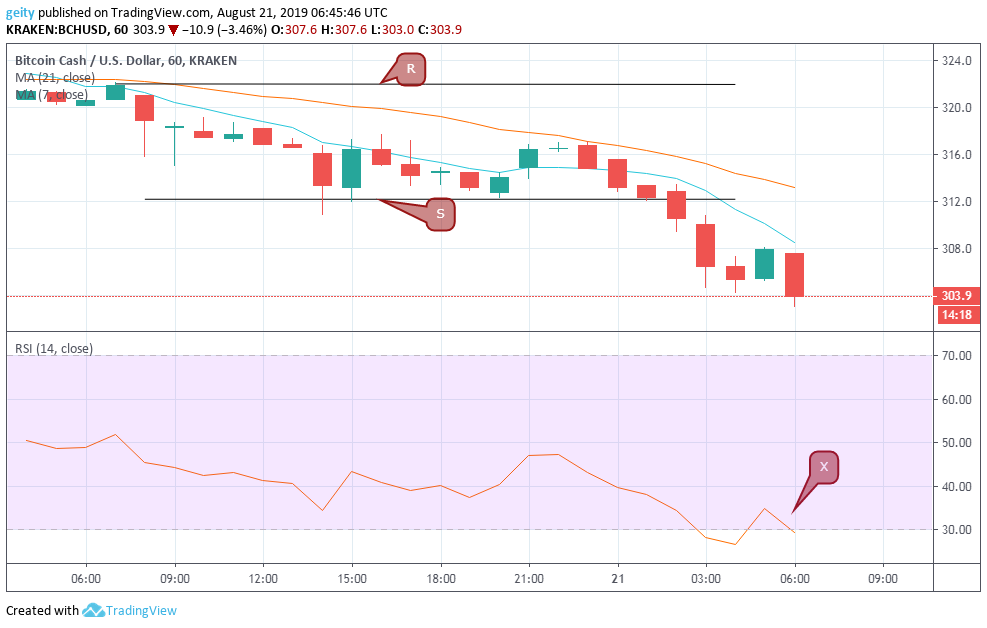
In the last 24hrs, Bitcoin cash has maintained a bearish run. The same trend is most likely to continue since the 21 day MA is actively trading above the 7 day MA. BCH/USD pair corrected losses yesterday to trade below the critical resistance level at $322.0. Additionally, the bearish pressure has defined the support level near $312.2.
The price was later on fluctuated further down to consolidate below $304.3. Apparently, BCH/USD pair escalated from $321.4 to currently changing hands at $303.9 that translate to a minimal dip of 5.4% over the intraday.
In addition, the RSI indicator (X) that moved from a high of 50 to the oversold zone also reflected the downward move. The bearish move also signaled a reduction in the investor’s sentiments that resulted in an increase in sellouts over the last 24hrs.
Bitcoin Cash Price Prediction (BCH/USD)
At the moment, all the technical indicators point at the fact that the incoming trend is bearish since they are both trading southwards. A break below $300.0 may promote a further downtrend. However, a break above $308.0 may trigger an upward rally.
Bitcoin Price Analysis (BTC/USD)
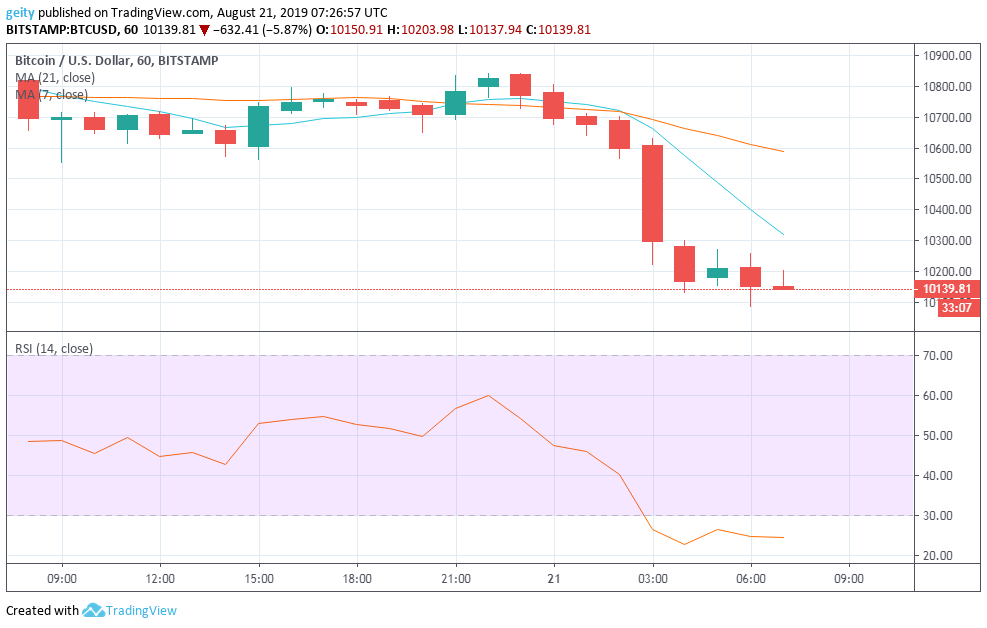
Like BCH, BTC/USD pair failed to break above the critical resistance level at $11000.0. BTC has massively declined from the closing point yesterday at $10695.49 to the current price of $10139.81. The market fist exhibited a medium-term period of consolidation between $10837.41 and $10596.78 level before a downside correction.
A breakout was later seen starting from 23:00 that fluctuated the price momentum down near $10139.81 that also confirmed an increase in selling pressure. The downside price move was signaled by the 21 day MA that crossed above the 7 day MA and the RSI indicator that moved from a high of level 60 to now trading below the negative zone. That is marked as the oversold market territory.
Bitcoin Price Prediction (BTC/USD)
If the price fails to maintain its position above the $10150 level, it might revisit the $9400 swing low. Notably, the dip was signaled by the moving averages that are both trading south ways. Conversely, if there is an upward correction, then a break above the $10596.78 is likely.
Ethereum Price Analysis (ETH/USD)
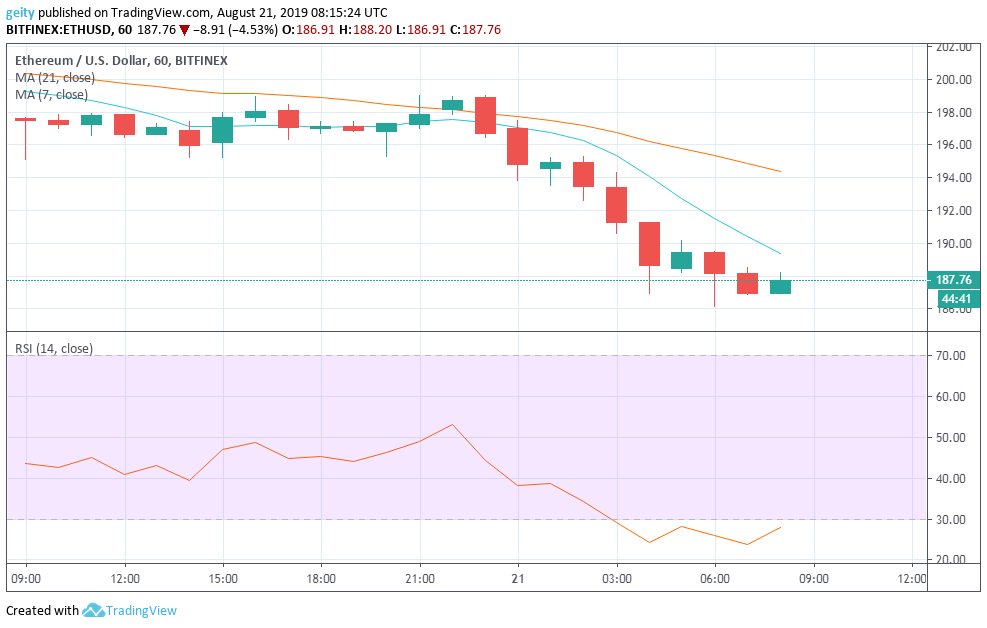
ETH/USD pair has also exhibited a strong bearish outlook that was indicated by the 21 day MA that hovered above the 7 day MA throughout the intraday. ETH price tested the key resistance level at $198.84 before a downside correction.
The dip has brought the current price at $187.76 that is slightly above the current support level $186.00. The RSI indicator is also below the oversold market territory that signaled a strong increase in selling pressure. This also shows that sellers are in control. However, the RSI indicator is currently pointing north that reflects a slight increase in investor’s sentiments.
Ethereum Price Prediction (ETH/USD)
If there is a bearish break below $185.0, a further decline towards $170.0 is likely. Conversely, if investor’s sentiments highly increase then an upside correction near $200.0 resistance will be anticipated.
Cryptocurrency Charts By Tradingview
Disclaimer: This is not trading or investment advice. The above article is for entertainment and education purposes only. Please do your own research before purchasing or investing into any cryptocurrency or digital currency.