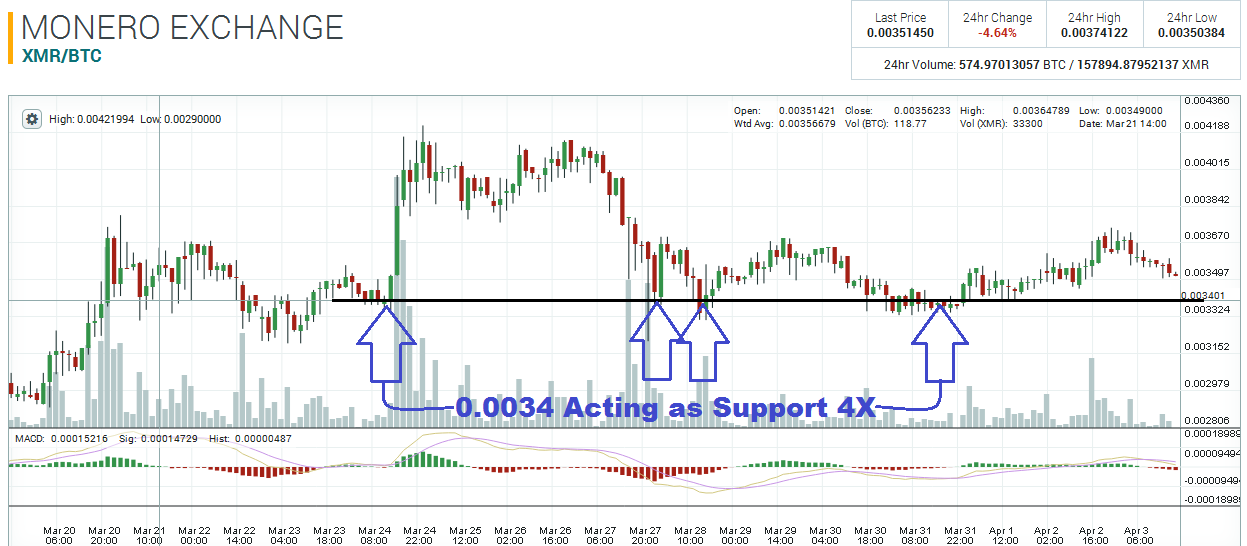
The 0.0034 pivot zone – which was outlined in my previous Monero technical analysis article – has become even more significant in the past 10 days. This level has acted as support about four times since my last article on the 24th of March. If at some point in the near future the market breaks underneath this level, the chances of a bear market will increase substantially.

Since the 20th of March, the 0.0037 price level has become a major resistance level. This area has acted as resistance about five times so far, and if the market doesn’t break above this area soon, the probability of a major sell-off will continue to climb.

Furthermore, the 2-hour chart is also showing a bearish signal. A clear Head & Shoulders pattern is visible and both shoulders line up with the pivot zone at 0.0037. Unless the market has enough buyers to break price above 0.0037 over the next few days, I would say price is likely to head lower to the support area at 0.0034.

Disclaimer: This is not trading/investment advice!
Chart Source: https://poloniex.com/exchange#btc_xmr
If you liked this article follow us on twitter @themerklenews and make sure to subscribe to our newsletter to receive the latest bitcoin and altcoin price analysis and the latest cryptocurrency news.