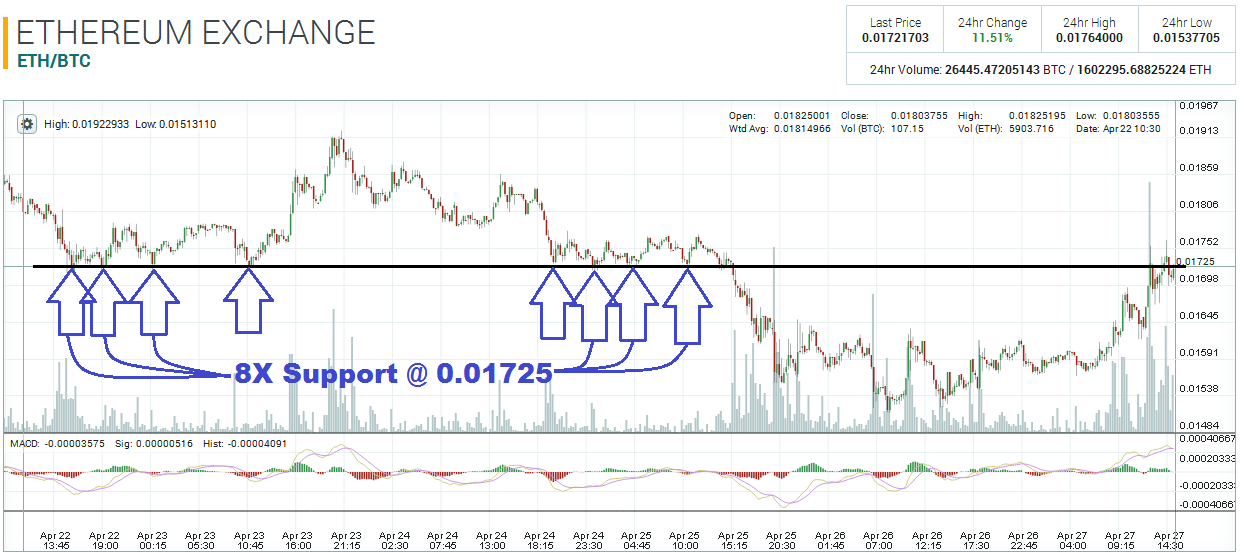
Since breaking underneath the big pivot at 0.017 several days ago, the Ethereum exchange rate has managed to climb back to 0.017. However, this area may now start to act as resistance. Actually, to get a little bit more specific, between the 22nd and 25th, 0.01725 propped-up price above eight times!!


Given the long-term as well as the most recent history of this area, it is very likely that the market will have a hard time getting above 0.017. Having said that, if it turns out that there is sufficient buying pressure to vault the market above 0.017 over the next few days, I would not be surprised to see a rally back the next big pivot zone at 0.019. The price action surrounding 0.017 will determine where the market goes from here.
While the higher time frames don’t show any overt signals, the 15-minute chart is showing some divergence on the MACD indicator. Divergence usually indicates depreciating momentum and frequently occurs ahead of key inflection points in the market.

If the market starts to drop from here, the 0.0162 area is likely to come into play. The 15-minute chart shows the multiple times the 0.0162 level was used over the past two days: three times as support; five times as resistance between the 25th and 26th.

Disclaimer: This is not trading/investment advice!
Chart Source: https://poloniex.com/exchange#btc_eth
If you liked this article follow us on twitter @themerklenews and make sure to subscribe to our newsletter to receive the latest bitcoin and altcoin price analysis and the latest cryptocurrency news.