The two pivots – 0.027 & 0.029 – that I have been writing about in the last few ETH tecnical analysis articles are continuing to exert their influence on the charts. Price managed to make it above 0.029, and even used this level as support on March 23, however, the market just couldn’t stay above 0.029 for very long. Given the extensive history of this pivot zone, any rallies in the future will have a hard time at 0.029!

When the market plunged underneath 0.029 on the 23rd, price also closed under 0.027. Since then, the 0.027 has started acting as resistance. If the market can’t get above 0.027 over the next several days, the chances of another sell-off will increase! Given that price is now trading under two major pivot zones, I would have to say that the current sentiment is bearish.

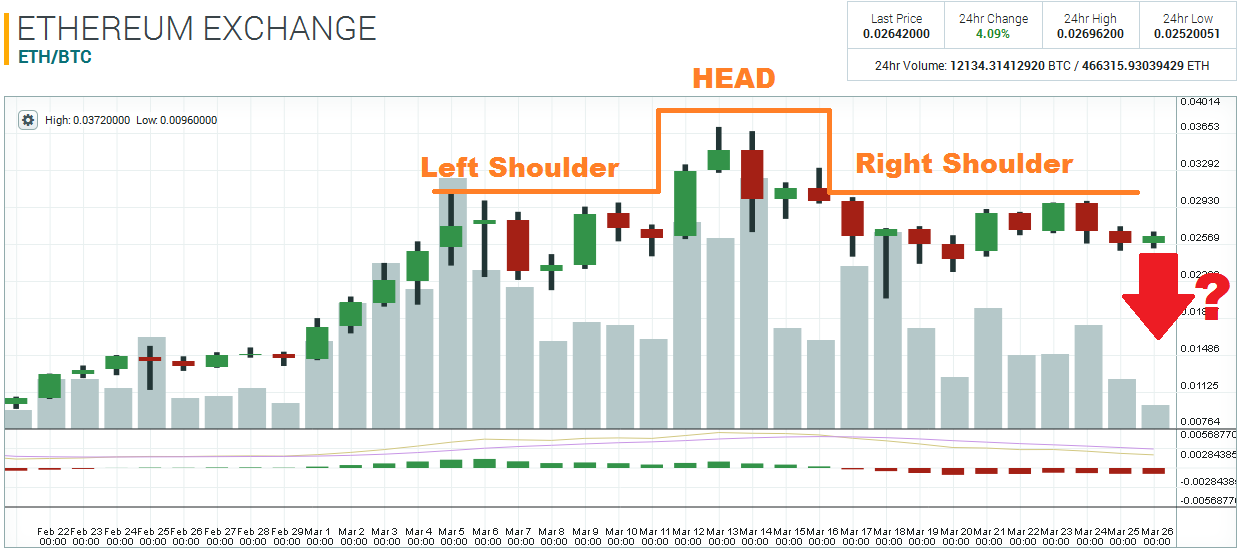
The daily Ethereum chart also has some bearish connotations – it shows a very clean Head & Shoulders pattern. This pattern has been in the making since the start of March, and both shoulders align with the major pivot zone at 0.029. If there isn’t enough buyers in the market to get the exchange rate above 0.029 again, the most likely outcome will be further selling. At this point, the path of least resistance seems to be down!

Disclaimer: This is not trading/investment advice!
Chart Source: https://poloniex.com/exchange#btc_eth
If you liked this article follow us on twitter @themerklenews and make sure to subscribe to our newsletter to receive the latest bitcoin and altcoin price analysis and the latest cryptocurrency news.