On the 29th of February, Monero was trading just underneath the big pivot zone at 0.0021 and my analysis article at the time showed that pressure was building up, and that a breakout may follow soon. Three days later, on the 3rd of March, the market broke above 0.0021 and rallied to a high of 0.00348785 in the space of two days.
The big questions now are: where does price go from here? Is another rally likely in the near future?
Since the big break on the 3rd, the 0.0027 area has become a very important price level from a technical perspective. This area has been used quite a few times over the past five days; twice as resistance on the 3rd and 4th; five times as support between the 5th and 7th. The Monero exchange rate dipped underneath 0.0027 today, so this level is very likely to now act as resistance, which may set the stage for further downside momentum. A rally back to the highs at 0.00345 is only possible, if price makes it above 0.0027 again.

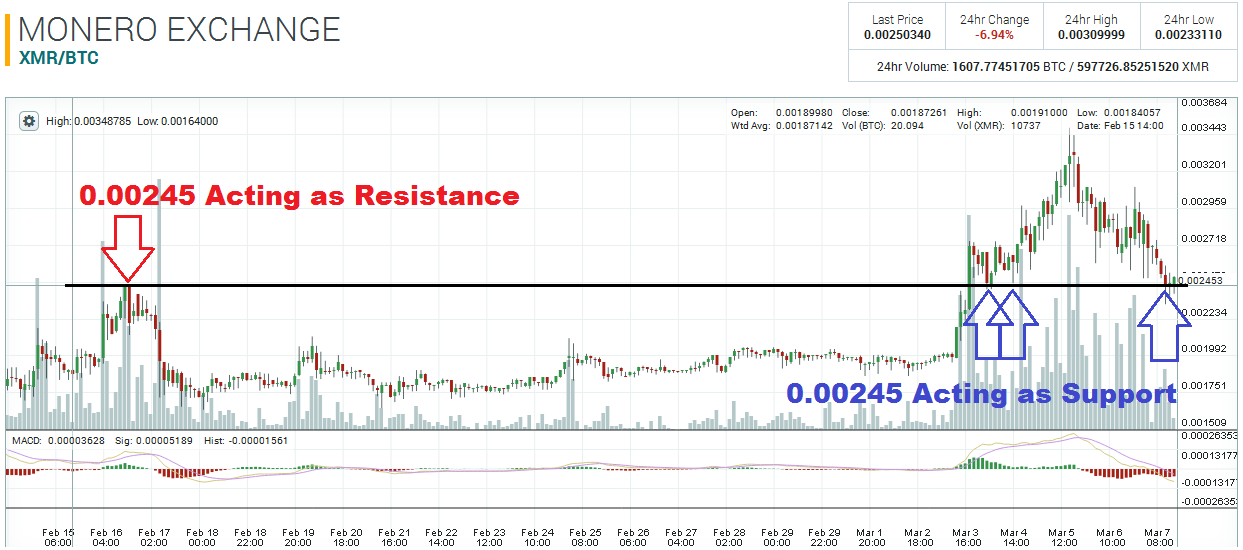
However, there is also the pivot zone at 0.00245, which is currently acting as support. This level acted as resistance on the 16th of February, and this area turned into support once price broke above it on the 3rd of March. If price slips underneath 0.00245 and trades there for 12-24h, 0.00245 will most likely turn into resistance, which in turn may send price tumbling down to 0.0021.

Disclaimer: This is not trading/investment advice!
Chart Source: https://poloniex.com/exchange#btc_xmr
If you liked this article follow us on twitter @themerklenews and make sure to subscribe to our newsletter to receive the latest bitcoin and altcoin price analysis and the latest cryptocurrency news.
No Responses