Since hitting a new all-time high of 0.031 on March 5, the Ethereum cryptocurrency has slid all the way down to 0.024. The drop in the past two days has left some very clear pivot zones on the charts.
The 0.029 has proved to be an important technical level. Once the market closed underneath this level on Saturday, 0.029 has acted as resistance about five times!

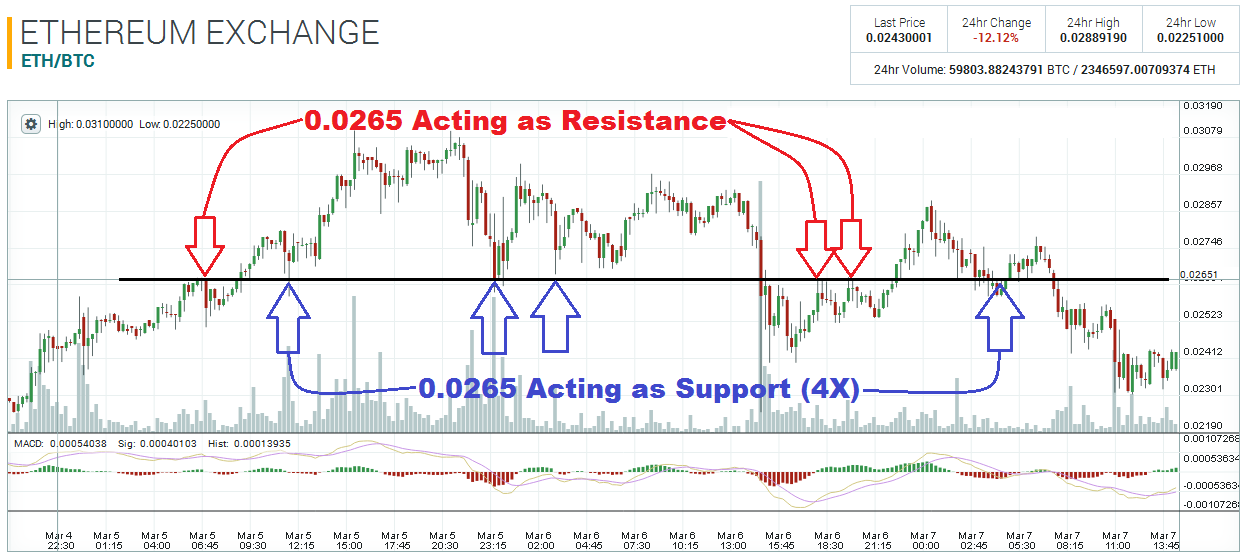
The 15-minute chart also shows how important the 0.0265 level has become. This area was respected quite extensively by the market over the weekend; three times as resistance; four times as support. Any rally over the next few days will most likely experience difficulty at 0.0265, as price will be approaching this pivot area from underneath. Mark this one on your charts!

ETH is currently trading around 0.024, and this price level goes back the beginning of this month, when it was first used as resistance on the 3rd. Since that day, 0.024 has acted as support about four times, including today. This area is crucial! If ETH trades under this pivot zone for a day or two, 0.024 may turn into resistance, and Ethereum may then slide down towards 0.02!

Disclaimer: This is not trading/investment advice!
Chart Source: https://poloniex.com/exchange#btc_eth
If you liked this article follow us on twitter @themerklenews and make sure to subscribe to our newsletter to receive the latest bitcoin and altcoin price analysis and the latest cryptocurrency news.
No Responses