The zone between $3.51 – $3.54 continues to be respected by the market. In my previous Litecoin technical analysis from last Tuesday, I speculated that pressure was mounting in the market due to the appearance of a triangle formation. Litecoin broke higher on Wednesday and managed to close above the massive resistance band between $3.51 – $3.54. And it seems that the market is now respecting this level once again, but this time as support. If the market doesn’t close bellow $3.50 in the next few days, the most likely direction for price is north.

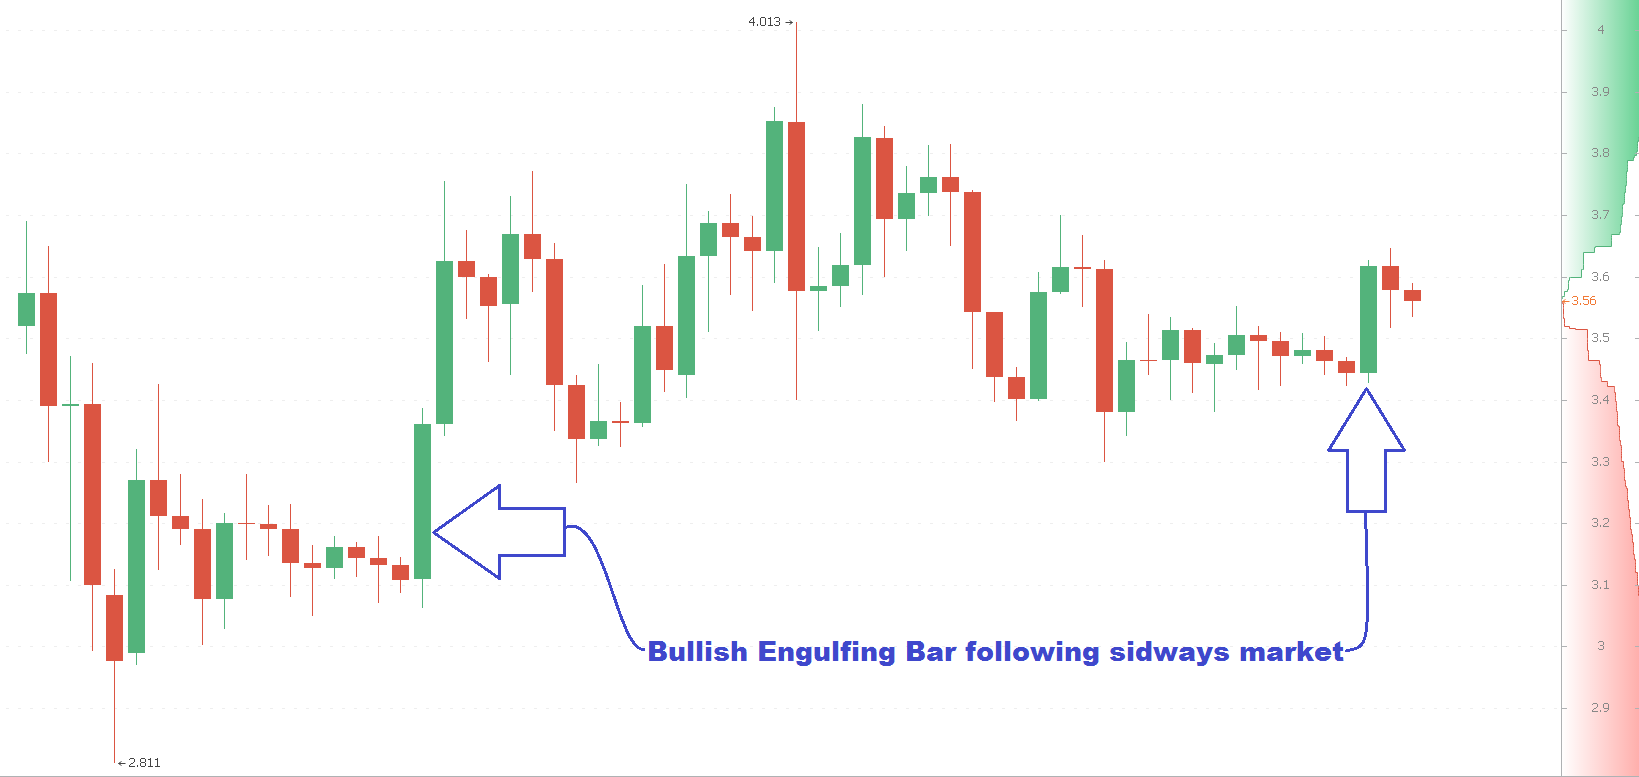
The daily chart is also painting a bullish near-term future for Litecoin. The bullish engulfing pattern on the daily chart is dead giveaway. A similar bar formation appeared on the 24th of November, which was followed by a significant rally! So, is Litecoin getting ready to rally now? I guess we’ll find out in the next few days.

Disclaimer: This is not trading/investment advice!
Image Source: 1
Chart Source: https://www.okcoin.com/market.do?symbol=1
If you liked this article follow us on twitter @themerklenews and make sure to subscribe to our newsletter to receive the latest bitcoin and altcoin price analysis and the latest cryptocurrency news.
No Responses