Ethereum was trading lower for most of December, but the 26th marked the beginning of a trend shift. The trend line that was respected for the better part of December, was broken on the 26th.

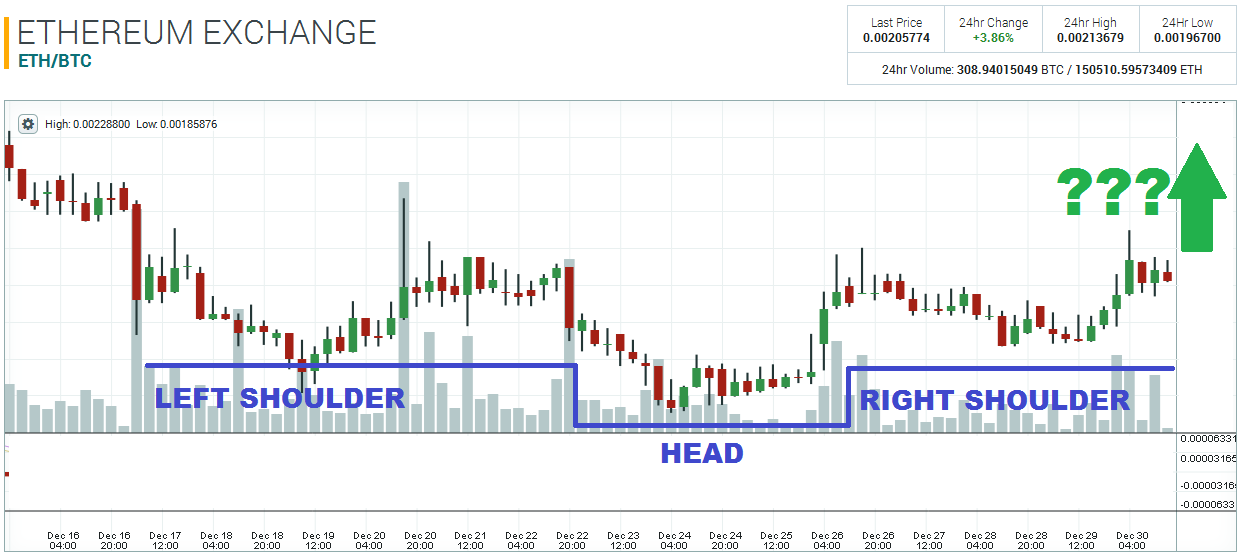
Although the trend line was violated, the area between 0.0021-0.00215 is still a major area of interest for traders. This zone has acted as resistance about five times this month. The market spiked above this pivot zone today, hitting a high of 0.00224174, and I think that 0.0021 is very likely to now turn as support. The 4-hour chart is also showing a Head & Shoulders pattern, which is another very bullish indicator.


Disclaimer: This is not trading/investment advice!
Chart Source: https://poloniex.com/exchange#btc_eth
If you liked this article follow us on twitter @themerklenews and make sure to subscribe to our newsletter to receive the latest bitcoin and altcoin price analysis and the latest cryptocurrency news.
No Responses