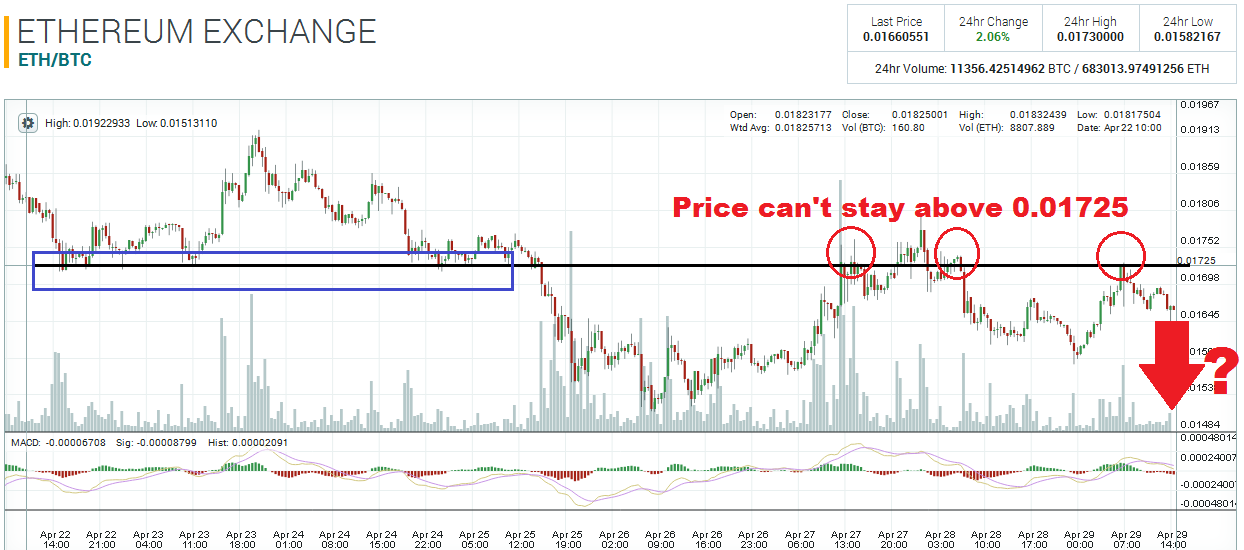
Since the 26th, the Ethereum bear market has taken a bit of a break and price has started to trade in a sideways market between 0.01725 and 0.0162 – two pivot zones that I outlined in my last ETH technical article as potential areas interest for traders.
The 0.0162 area is now acting as support; 0.01625 provided support on the 28th; 0.016 acted once as support today.

While price did penetrate the 0.01725 pivot area on the 28th, the market has been unable to trade above this level for any length of time. In fact, this week, the 0.01725 area has acted as resistance about three times. Price is now sandwiched between these two well-established pivots zones. If price makes it under 0.0162 at some point over the next few days, I would expect the bear market to continue.

Disclaimer: This is not trading/investment advice!
Chart Source: https://poloniex.com/exchange#btc_eth
If you liked this article follow us on twitter @themerklenews and make sure to subscribe to our newsletter to receive the latest bitcoin and altcoin price analysis and the latest cryptocurrency news.