The 0.0205 price level has become very significant over the last ten days. This area acted as resistance about three times between the 11th and 15th of April. When price broke above this level on the 17th, 0.0205 started acting as support. This price area is now considered a key pivot zone and any break under this technically-significant level will most likely send price tumbling down to 0.019!

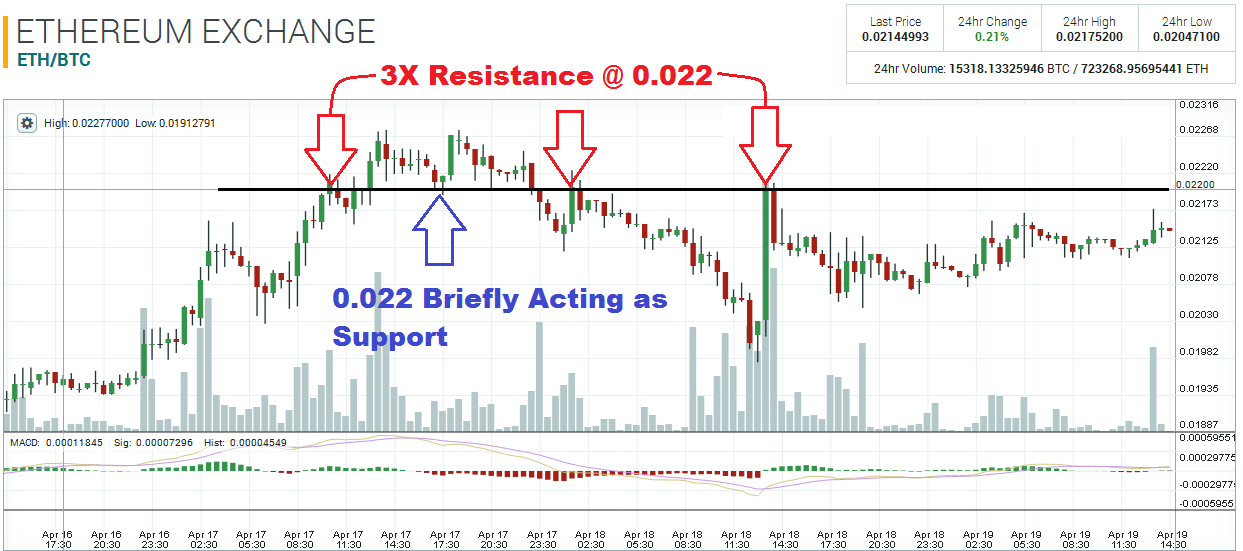
The biggest obstacle to ETH breaking higher is the monster pivot zone between 0.0215 – 0.022. I have written about this area many times in my prior Ethereum articles, and it seems that this level is still being respected by the market. During the most recent bout of bullish price action around April 17, price did get above 0.022, briefly, but was unable to stay above this zone. In fact, the 30-minute chart shows this dynamic quite clearly:


If price manages to climb above 0.022 once again, and stays above 0.022 for at least 24h – a rally towards 0.024 would be very likely.
Something to keep in mind: while the 0.022 area may continue to act as resistance in the near future, the long-term trend line was broken on the 17th! Is the ETH bear market finally over?

Disclaimer: This is not trading/investment advice!
Chart Source: https://poloniex.com/exchange#btc_eth
If you liked this article follow us on twitter @themerklenews and make sure to subscribe to our newsletter to receive the latest bitcoin and altcoin price analysis and the latest cryptocurrency news.