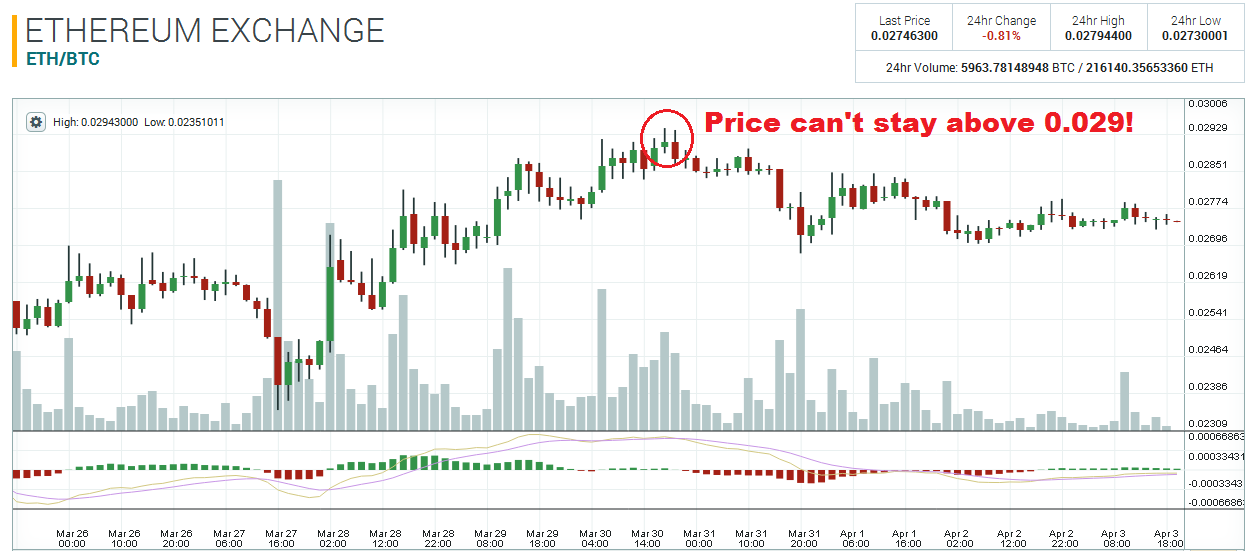
While ETH managed to trade around 0.029 on the 30th of March, price just can’t seem to stay above 0.029 for any length of time. Even the NY times article wasn’t enough to get the market above this iron pivot level! The Head & Shoulders pattern on the daily chart – which I wrote about in my last Ethereum technical analysis article – is still valid. The bull market for ETH will not continue if the market keep failing to break above 0.029!

Since the end of March, the 30-minute chart shows that 0.0284 has been used multiple times by the market; four times as support; three times as resistance. Since ETH is now trading below 0.0284, this pivot zone is likely to act as resistance in the future. In addition to the behemoth resistance at 0.029, the 0.0284 pivot zone is another potential barrier that the market has to deal with now. Not looking too good for the bulls!

Although there are plenty of potential obstacles, there is another major support level that is currently holding the market in place. Even during the hype of the NY times article, the 0.027 held its ground and acted as resistance! Once price got over 0.027 on the 28th of March, this level has acted as support about four times. Should price break under 0.027 again, a sell-off down to 0.024 will not be out of the question.

Disclaimer: This is not trading/investment advice!
Chart Source: https://poloniex.com/exchange#btc_eth
If you liked this article follow us on twitter @themerklenews and make sure to subscribe to our newsletter to receive the latest bitcoin and altcoin price analysis and the latest cryptocurrency news.