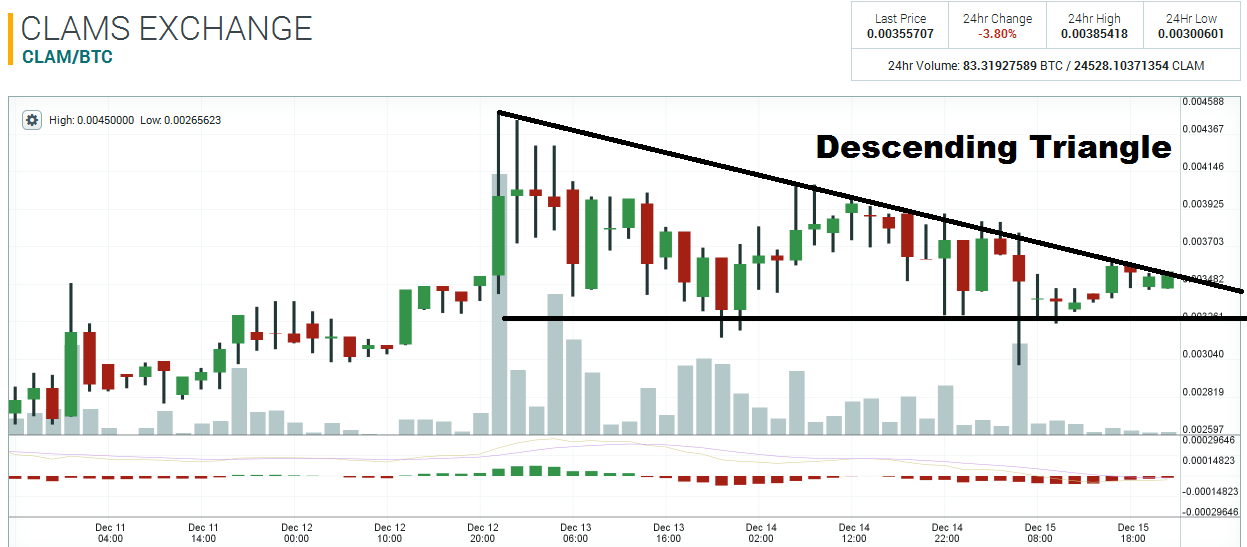
The CLAMS digital currency entered a bull market at the start of December that seems to be unstoppable, but is it time to start getting cautious? Price is currently trading above a very significant pivot zone. The 0.0033 area gave the market quite a bit of problems last week – acting as resistance about three times. The market managed break above 0.0033 on the 12th, so this level has now turned into support – propping-up price on three occasions. Although the market is in a clear uptrend and currently receiving a lot of support from this pivot zone – there is another formation on the chart that is signaling potential trend exhaustion.

The 2-hour chart shows a clear descending triangle formation. These patterns are very indicative of market pressure accumulation, which is usually resolved with a very abrupt break. In this particular case, price seems to be pushed closer and closer to the pivot at 0.0033, and if price slips underneath this massive pivot, the sell-off could be very explosive.

Disclaimer: This is not trading/investment advice!
Chart source: https://poloniex.com/exchange#btc_clam
If you liked this article follow us on twitter @themerklenews and make sure to subscribe to our newsletter to receive the latest bitcoin and altcoin price analysis and the latest cryptocurrency news.
No Responses