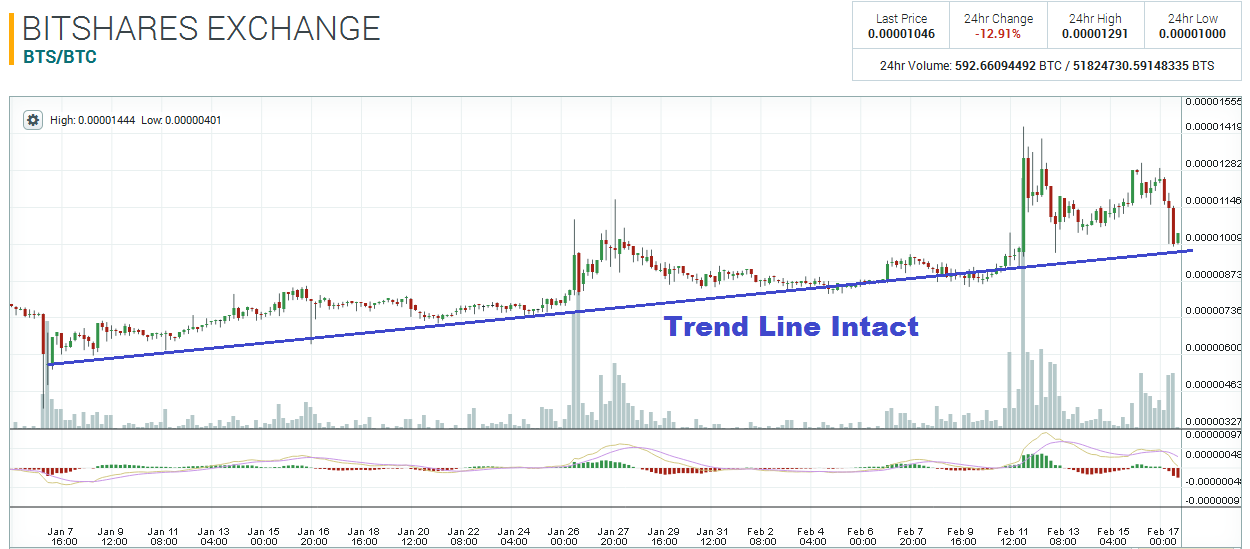
The BitShares digital currency hit a high of 0.00001444 on the 12th of February, and since that day, there hasn’t been any sufficient buying momentum to rally to new highs. Instead, price has oscillated around the 0.00001170 price level for a whole week. The 30-minute charts reveals that the 0.0000117 price level has been used as support a total of four times in the past six days; twice on the 12th; twice on the 16th. The 0.0000117 pivot also acted as resistance three times in that same period. This pivot should definitely be marked on your charts.

The market is currently sitting on another important technical level. The 0.00001 area acted as resistance on the 11th of February. This area also acted as support today, and once on the 13th as well. A break underneath 0.00001 may set the stage for a much bigger sell-off.

The long term trend line is still intact, so technically speaking, BitShares has not entered a bear market yet.

Disclaimer: This is not trading/investment advice!
Chart source: https://poloniex.com/exchange#btc_bts
If you liked this article follow us on twitter @themerklenews and make sure to subscribe to our newsletter to receive the latest bitcoin and altcoin price analysis and the latest cryptocurrency news.
No Responses